|
|
We recommend you start small, maybe scan and report on one or two IPs. Review the reports, fix the vulnerabilities found, re-scan the IPs to verify your fixes, and rerun your reports. Once you have this process down you'll feel more comfortable scanning larger sets of IPs.
The simple answer to what to report on is this: any IP in your account that has been scanned for compliance. IPs may include any devices on your network: routers, switches, hubs, firewalls, servers (all common operating systems), workstations, databases, desktop computers, printers, and wireless access devices.
We recommend you schedule your scans to run automatically (daily, weekly, monthly) and create reports with at least the same frequency. That way you'll always have the current compliance status for your hosts. You can even set up report schedules so your reports are launched automatically (daily, weekly, monthly).
You can choose to be notified via email each time a report completes. The email gives you a summary of the results and a secure link to the report. Select User Profile below your user name, go to the Options section and select Report Notification. You'll notice additional email notifications you can opt in to.
The scan settings you choose at scan time impact how we conduct scans. Once scan results are processed we save the compliance data per host - this makes it possible for us to include the latest compliance data in your reports. Keep in mind your reports will include the most recent compliance data stored for each host.
Tip: We recommend you use consistent scan settings. This gives you the most accurate picture of your host security and compliance trends over time.
Check out: Policy Report | Policy Summary | Compliance Scorecard Report | Individual Host Report | Control Pass/Fail Report | Authentication Report | Mandate Based Report
Go to Assets > Host Assets to see the IPs you can scan and report on. If the IPs you want to report on are not listed then add them (or have your manager add them and assign them to you) and then scan them. One way you can tell if an IP address has been scanned is to do an asset search. Go to Assets > Asset Search, enter the IP and click Search. Your IP address will appear in the search results if it has been scanned. Just click it and you'll see host information.
Asset groups are user-defined groupings of host assets (IP addresses). You can group hosts by importance, priority, location, ownership, or any other method that makes sense for your organization. When you report on an asset group, only the hosts in the group are included. This allows you to limit the scope of your reports to a particular group of hosts or a subsection of your network, making the reports more manageable. Learn more
Asset tagging is another method for organizing and tracking the assets in your account. You can assign tags to your host assets. Then when launching scans and reports you can select tags associated with the hosts. This dynamic approach is a great way to ensure you include all hosts that match certain criteria, even if your network is constantly changing as hosts are added and removed. For example, scan and report on all Windows XP hosts or all hosts with Port 80 open. There are multiple ways to create tags, for example you can create tags from asset search (go to Assets > Asset Search) or by using the AssetView application. Learn more
Your scan(s) must be complete. You'll know this when the scan status shows "Finished" on the scans list. Scan results must be ready. We'll merge (process) your scan results into your account after the scans finish. Watch for the solid green circle ![]() next to your scans in the scans list to know whether the scan results are processed. Then you're ready to launch reports - and the compliance data from the processed scans will be included.
next to your scans in the scans list to know whether the scan results are processed. Then you're ready to launch reports - and the compliance data from the processed scans will be included.
You'll see the compliance status in your compliance reports and throughout the user interface. We'll update the status automatically when new scan results are processed.
Passed means the expected value and the actual value match for the control evaluation of the host.
Failed means the expected value and the actual value do not match.
Error means an error occurred during control evaluation on the host. (Tip - Reporting options in user defined control settings allow you to ignore errors and show a different status. Learn more)
A single asset can have multiple technology instances. You may choose to purge compliance data for only the instances that are no longer active, and keep compliance data for active instances. A Manager can enable the Inactive Instance Purge option (under PC > Scans > Setup > Inactive Instance Purge) and set a timeframe in order to automatically purge instances when they have not been evaluated within the specified timeframe. This way you won't see data in your reports for instances that are no longer active. This is especially useful when Scan by Policy is used. With Scan by Policy, we keep instance data for all previously discovered instances even if they are no longer present on the asset. (Note that we will only purge an instance if at least one instance of the same technology type was evaluated within the timeframe.)
Evidence is the Expected value and the Actual value for the control on the host. The Expected value is the value defined in the compliance policy. The Actual value is the value returned during the last compliance scan on the host. These values are compared during the evaluation process for the control on the host, resulting in a Passed or Failed status. A check mark indicates the value is selected in the policy.
Understanding Evidence - Control values may include integers, regular expressions and Windows permissions. Learn more
Extended evidence includes additional findings/information collected during the evaluation of the control on the host. For example, this may include results returned from queries made by the scanning engine when checking the control value. Extended evidence appears below the expected and actual values in the report.
You can choose to include remediation information for control technologies in your compliance reports. Just choose from the Remediation Info options on the Layout tab in your policy report template.
For system defined controls, your reports will show remediation information set by Qualys.
For user defined controls, your reports will show remediation information added by users. To add remediation information to a control, go to Policy > Controls, and then edit an existing control or create a new control. Scroll down to the Control Technologies section and enter remediation information for each control technology you're interested in.
You'll see N/A when no remediation information is available.
You can add a summary section to your report which highlights required values that are missing or are unexpected in the failed controls. This makes it easier to identify what configuration settings caused failure of a control. This is especially useful in controls that return long lists of data such as CID’s that return lists of users on a system in groups or with certain privileges.
Simply go to Reports > Templates > New > Policy Template and enable the options under Cause of Failure section. Then run a Policy Compliance report using this template and in the report navigate to the Cause of Failure section of a failed control.
Note that for some of the cardinalities:
- We are not showing the Cause of Failure section for controls that have multiple datapoints.
- We are showing "Unexpected values" for controls having 'does not contain' and 'match none'.
- We are showing both Unexpected values and Missing values for cardinalities "Matches" , "Intersect".
- We are showing only Missing Value for 'contains' cardinality.
- We are showing only Unexpected value for "is contained in" cardinality.
There are several dates that appear in policies and policy compliance reports. This section describes those dates and when they’ll be updated.
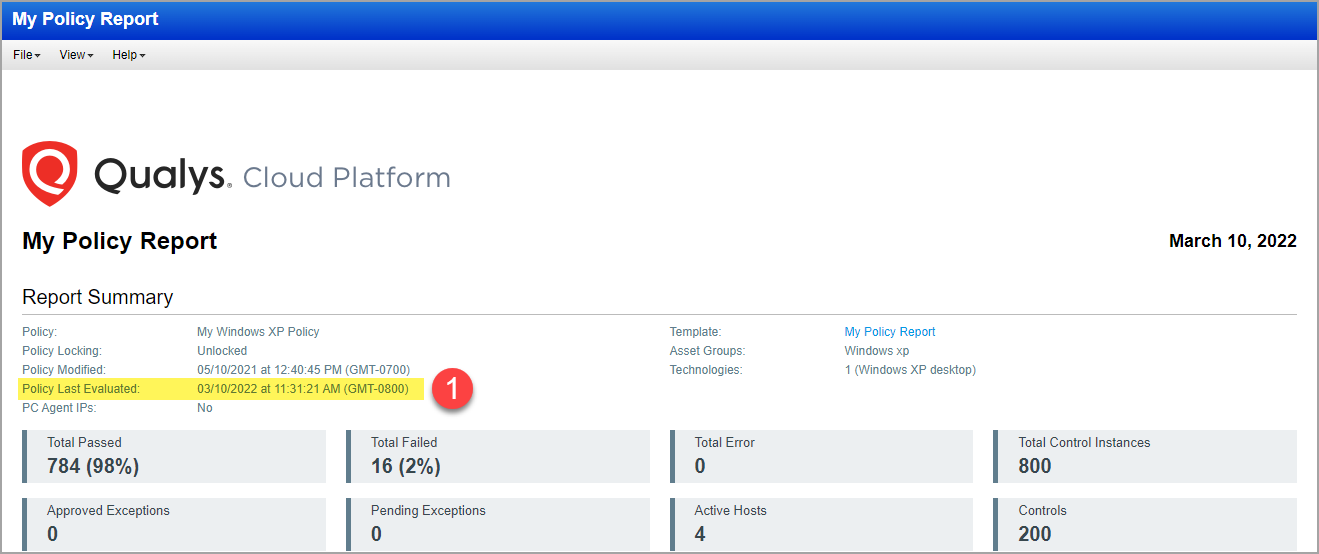
(1) Policy Last Evaluated Date (for policy): This date appears in the Report Summary section. This is the date when policy evaluation is complete. This value gets updated every time policy evaluation is triggered for a host. If multiple targets are scanned, this value will be updated each time a policy evaluation occurs for a target. Thus, this value will always be higher (or same) than the individual "Evaluation date" for the controls in the report. This date is updated even if there is no change in data collected for controls in successive scans.
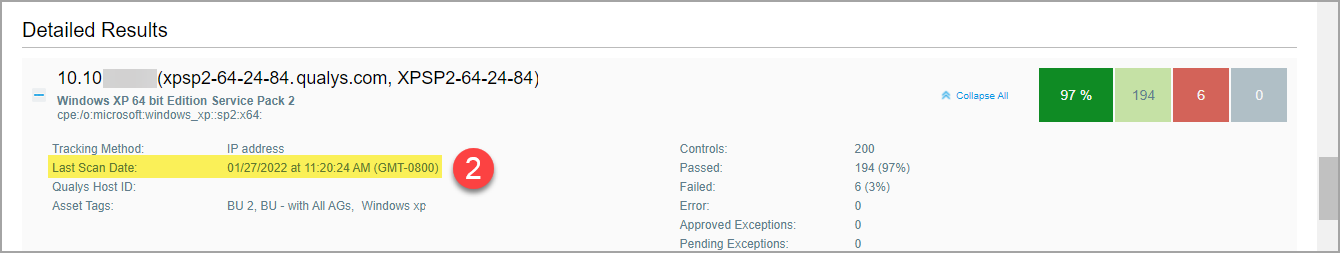
(2) Last Scan Date (for host): This date appears in the Detailed Results section for each host included in the report. This is the date of the most recent scan on the host. This date is updated for all types of scans on the host - full scans, restricted scans using the “Scan by Policy” option, and Agent scans.
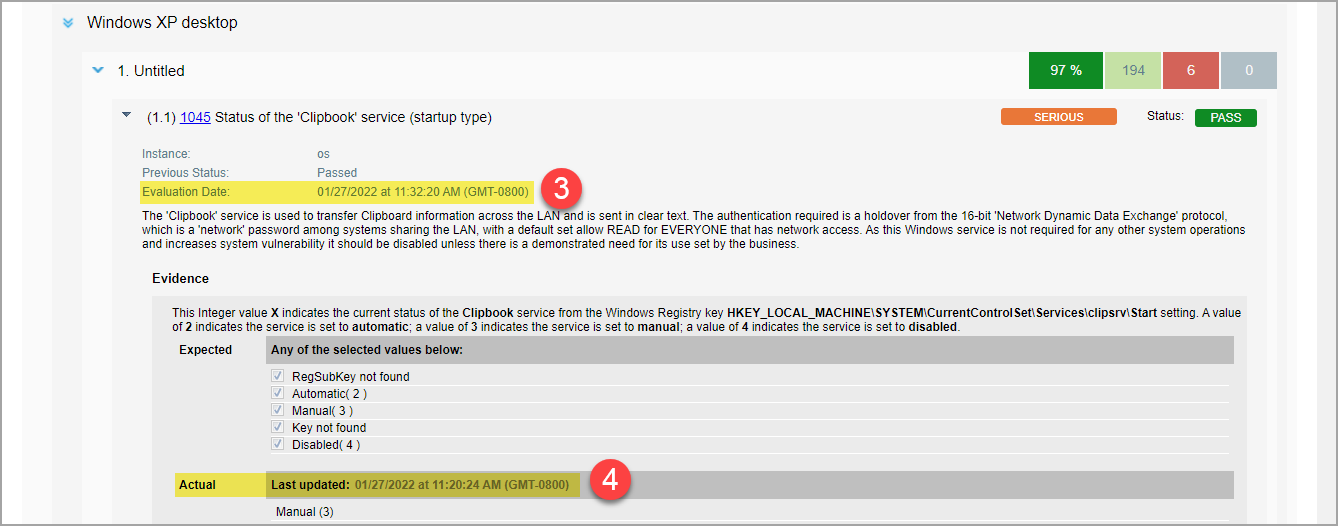
(3) Evaluation Date (for control): This date appears when you expand control details. This is the date a control was last evaluated. Control evaluation happens as a part of policy evaluation. Hence, this value will be lower (or same) as the "Policy Last Evaluated" date. Typically, policy evaluation is triggered right after scan data is collected. However, sometimes due to processing overload there could be some delay.
Also, if there is no change in the scan data (all the collected scan data for controls is the same) for a target in successive scans, none of the associated policies will get evaluated. As a result, this value remains unchanged for the controls. However, we do update the value of "Policy Last Evaluated".
(4) Actual Last Updated Date (for control value): This date appears in the Evidence section for a control with the Actual value. This date is updated every time we collect scan data for the control, including data collected from full scans, restricted scans using the “Scan by Policy” option, and Agent scans.
Consider the type of scan to know when data is collected for controls:
- Full Scan/Agent Scan: Collects all the applicable data based on the technologies identified on the target host.
- Scan by Policy: Collects data for only those controls specified in the policies used to restrict the scan. Hence, the "Actual Last Updated Date" value in reports may only be updated for these controls. Controls in a policy may show different values if the subset of the controls is part of another policy which is also specified in the "Scan by Policy" setting of another option profile used for running scans.