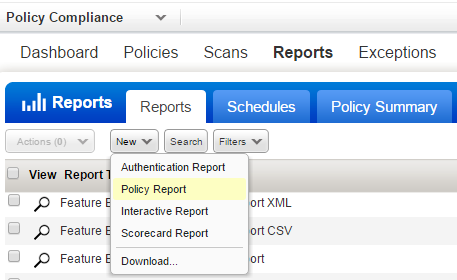
The Policy Report tells you whether your hosts are compliant with a specific compliance policy. Want to report on multiple policies? Use the Compliance Scorecard Report.
|
When a host is scanned, there may be multiple technologies detected for the host and multiple instances of those technologies. You can report on a single host instance and all other results for the host will be filtered out. Here are the steps: 1) choose a policy, 2) select the option Single Instance, and 3) click the Select Host Instance button. You'll get a list of technology instances found for the hosts in the policy. Choose one host instance to include in the report. |
|
Want to report on asset tags?Want to report on asset tags? You have a few options: - Choose "All Assets in policy" to include hosts that match the asset groups and asset tags in your policy. - Choose "Select Asset Tags" to include hosts that match selected tags only. Tags that are assigned to the policy appear in bold. Feel free to add/remove tags for the report. Know more: Using asset tags |
|
Want to report on agent hosts?Want to report on agent hosts? Applicable to accounts with PC Agent. If you selected the option "Include all hosts with PC agents" in the policy editor, then you must choose the Report Source option "All assets in policy" to include agent hosts in your report. Agent hosts will be identified with the tracking method AGENT in your report. If you added the asset tag "Cloud Agent" to your policy then choose the Report Source option "Select Asset Tags" to include hosts that have the Cloud Agent tag assigned. |
|
What's in my report |
|
How is the trend start date calculated?How is the trend start date calculated? It's based on the trend duration set in your report template (under Trending). If the trend duration is 7 days, then the trend start date is 7 days before the report generation date. Important: Trend data will appear in the report only if all asset groups in the policy were included in the report. |
|
Which hosts are counted as Active?Which hosts are counted as Active? A host is considered "active" when at least one control in the policy was evaluated on the host, resulting in a passed or failed status. If a host assigned to the policy is not counted, then none of the controls in the policy were evaluated on that host. Possible reasons for this include: the host has never been scanned for compliance or the compliance scan data was purged, authentication to the host failed, or the host is not relevant to the policy (for example, a Windows host assigned to a Linux policy). |
|
Why do I see "There is no data available"?Why do I see "There is no data available"? You'll see this if the policy was not yet created on the trend start date. For example, let's say you create a new policy on June 10. If you run a report on this policy on June 15, then the reporting engine has trending data for the last 5 days. If the report template is set to 7 days trend duration, then the trend start date is June 8 which is before the policy creation date so no data is available for the Trend Start Summary section. The other trend graphs in the policy report will show trend data for the last 5 days only. |
|
What does This appears next to deprecated controls. A workflow is provided in the Policy Editor for replacing deprecated controls. |
|
Tell me about Control StatisticsTell me about Control Statistics This includes a list of controls in each section of the policy with the percentage of hosts that passed for each control. For example, if 6 hosts are included in the report and a control shows 50%, then the control passed on 3 of the 6 hosts. If a control shows 100%, then the control passed on all hosts in the report. If a control shows 0%, then the control failed on all hosts in the report. |
|
Tell me about Host StatisticsTell me about Host Statistics This includes a list of hosts in the policy. For each host the report shows the last scan date and the percentage of controls that passed on each host. For example, if 25 controls in the policy were evaluated on the host and 10 of those controls passed, then the percentage of passing controls for the host is 40%. If a host shows 100%, then all controls evaluated on the host passed. If a host shows 0% then none of the controls evaluated on the host passed. |
|
Tell me about Cloud MetadataTell me about Cloud Metadata When you include Host Statistics in your report, you also have the option to include cloud metadata for each of your AWS assets. In the policy report template, select the section "Cloud Metadata" under Sections on the Layout tab. When enabled, you’ll see the following cloud metadata for each AWS asset in your report (all formats): - Cloud Provider Cloud Resource Metadata for AWS includes: Public IP Address, Private IP Address, VPC ID, Subnet ID, Instance Type, Instance State, Group Name, Group ID, Region Code, Availability Zone, Reservation ID, Is Spot Instance, Local Hostname, MAC Address, Private DNS Name, Public DNS Name |
|
Tell me about compliance status (posture)Tell me about compliance status (posture) Possible values are: Passed - The expected value for the control matches the actual value returned during the last compliance scan on the host. Failed - The expected value for the control does not match the actual value returned during the last compliance scan on the host. PassedE - The host is exempt from the control. This means that an exception was requested and accepted for the control on the host. Error - An error occurred during control evaluation on the host. (Tip - Reporting options in user defined control settings allow you to ignore errors and show a different status.) |