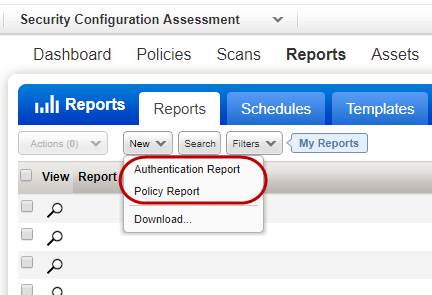
Run Policy reports to get an up to date compliance posture against the CIS benchmarks of your systems. You can generate reports showing discovered issues, configuration details, and relevant control information. We recommend you check out the Authentication Report to be sure authentication passed for all your target systems - if you have the VM app you probably are familiar with this report.
Launch the Authentication Report to see the authentication status for your scanned hosts: Passed, Failed, Passed with insufficient privileges or Not Attempted. If authentication fails, use details in the report to troubleshoot the issue before your next scan.
|
Help with report settings |
|
Selecting IPs for the reportSelecting IPs for the report There are several ways to specify the IPs you want to report on - select business units, asset groups, IPs/ranges or asset tags (if available). Tell me more about: Still need help? Check out Reporting - The Basics. |
|
Include additional host infoInclude additional host info Select "Additional Host Info" at run time to include for each host 1) the host's operating system, 2) the last time the host was scanned with authentication, and 3) the last time authentication was successful. |
|
Schedule settingsSchedule settings You'll need to make these selections: Email notificationsEmail notifications You can choose to send an email notification when a new report is available by choosing distribution groups, including users with Qualys accounts and those who do not have accounts. Will the report be included? This depends on whether you've selected this in your settings under Reports > Setup > Scheduled Reporting. Time zone selectionTime zone selection Choose your local time zone (GMT shift and location) and if your time zone observes DST, the "Auto adjust during Daylight Saving Time" option is selected by default. We'll automatically adjust the start time for your scheduled report during time changes. This option is disabled for locations that never observe DST like Arizona and Hawaii. Don't see the scheduling settings?Don't see the scheduling settings? Your subscription must have the Scheduled Reporting feature enabled. Please contact support or your account manager if you would like to enable this feature. Also a Manager must opt in to the New Data Security Model by going to Users > Setup > Security. |
|
What's in my report |
|
Tell me about authentication status levelsTell me about authentication status levels Possible status levels are: Passed - Authentication to the host was successful. Failed - Authentication to the host was not successful. Refer to the Cause column for additional information. The credentials used in the authentication attempt appear so that you can troubleshoot the issue. Passed* - (Applies only to PC and SCA) Authentication to the host was successful but the login account had insufficient privileges. Make sure the user account provided in the authentication record meets the minimum account requirements. Learn more Not Attempted - authentication to the host was not used. Perhaps you've never scanned the host using authentication or you did but the host scan data was purged. |
|
Tell me about the Summary section of my reportTell me about the Summary section of my report For each IP, business unit, asset group or asset tag included in the report, you'll see the total number of hosts at each authentication status level. For example, if your report shows "4 of 6 66% Successful" for a particular asset group, then 6 hosts in the asset group were successfully scanned. Out of the 6 hosts scanned, the scanning engine was able to authenticate to 4 hosts. This means that the scanning engine authenticated to 66% of the scanned hosts for the group. |
|
Check out the Cause column to get the login ID used during the authentication attempt. Review your authentication record for the host/type and the account privileges to troubleshoot the issue. |
|
Tell me about the host technologyTell me about the host technology When you run this report from the PC application, you'll see the host technology associated with each host instance - this is the technology the host’s operating system is mapped to. |
|
Tell me about the host instanceTell me about the host instance If the scan information applies to a technology version on the host, like an Oracle version, instance information appears in this format: Port <number>, SID <value>. For example: Port 1521, SID ora010203p. |
|
Tell me about Last Auth and Last Success datesTell me about Last Auth and Last Success dates You'll see these dates in your report when "Additional Host Info" was selected at run time. Last Auth - The last time each host was scanned using authentication - this is when the status was last updated to Passed or Failed. Last Success - The last time authentication was successful for each host. N/A indicates that the host has been scanned with authentication enabled but it has not been successful. |
| Tell me about Host IDTell me about Host ID
If you select the Host ID checkbox on the Report Details page, you see this column in the report. This column contains the host ID for each host in the report. |
| Tell me about All Asset TagsTell me about All Asset Tags
If you select the All Asset Tags checkbox on the Report Details page, you see this column in the report. In this column, you see all the tags associated with each asset. These tags include the ones you explicitly specify in the report source and also the ones that are not within the scope of your report but are associated with the assets included in the report.
|
The Policy Report tells you whether your hosts are compliant with a specific CIS compliance policy.
|
Help with report settings |
|
When a host is scanned, there may be multiple technologies detected for the host and multiple instances of those technologies. You can report on a single host instance and all other results for the host will be filtered out. Here are the steps: 1) choose a policy, 2) select the option Single Instance, and 3) click the Select Host Instance button. You'll get a list of technology instances found for the hosts in the policy. Choose one host instance to include in the report. |
|
Want to report on asset tags?Want to report on asset tags? You have a few options: - Choose "All Assets in policy" to include hosts that match the asset groups and asset tags in your policy. - Choose "Select Asset Tags" to include hosts that match selected tags only. Tags that are assigned to the policy appear in bold. Feel free to add/remove tags for the report. Know more: Using asset tags |
|
Scheduling settingsScheduling settings Tell me more about: Email notificationsEmail notifications You can choose to send an email notification when a new report is available by choosing distribution groups, including users with Qualys accounts and those who do not have accounts. Will the report be included? This depends on whether you've selected this in your settings under Reports > Setup > Scheduled Reporting. Time zone selectionTime zone selection Choose your local time zone (GMT shift and location) and if your time zone observes DST, the "Auto adjust during Daylight Saving Time" option is selected by default. We'll automatically adjust the start time for your scheduled report during time changes. This option is disabled for locations that never observe DST like Arizona and Hawaii. Don't see the scheduling settings?Don't see the scheduling settings? Your subscription must have the Scheduled Reporting feature enabled. Please contact support or your account manager if you would like to enable this feature. Also a Manager must opt in to the New Data Security Model by going to Users > Setup > Security. |
|
What's in my report |
|
How is the trend start date calculated?How is the trend start date calculated? It's based on the trend duration set in your report template. If the trend duration is 7 days, then the trend start date is 7 days before the report generation date. Important: Trend data will appear in the report only if all asset groups in the policy were included in the report. |
|
Which hosts are counted as Active?Which hosts are counted as Active? A host is considered "active" when at least one control in the policy was evaluated on the host, resulting in a passed or failed status. If a host assigned to the policy is not counted, then none of the controls in the policy were evaluated on that host. Possible reasons for this include: the host has never been scanned for compliance or the compliance scan data was purged, authentication to the host failed, or the host is not relevant to the policy (for example, a Windows host assigned to a Linux policy). |
|
Why do I see "There is no data available"?Why do I see "There is no data available"? You'll see this if the policy was not yet created on the trend start date. For example, let's say you create a new policy on June 10. If you run a report on this policy on June 15, then the reporting engine has trending data for the last 5 days. If the report template is set to 7 days trend duration, then the trend start date is June 8 which is before the policy creation date so no data is available for the Trend Start Summary section. The other trend graphs in the policy report will show trend data for the last 5 days only. |
|
What does This appears next to deprecated controls. A workflow is provided in the Policy Editor for replacing deprecated controls. |
|
Tell me about Control StatisticsTell me about Control Statistics This includes a list of controls in each section of the policy with the percentage of hosts that passed for each control. For example, if 6 hosts are included in the report and a control shows 50%, then the control passed on 3 of the 6 hosts. If a control shows 100%, then the control passed on all hosts in the report. If a control shows 0%, then the control failed on all hosts in the report. |
|
Tell me about Host StatisticsTell me about Host Statistics This includes a list of hosts in the policy. For each host the report shows the last scan date and the percentage of controls that passed on each host. For example, if 25 controls in the policy were evaluated on the host and 10 of those controls passed, then the percentage of passing controls for the host is 40%. If a host shows 100%, then all controls evaluated on the host passed. If a host shows 0% then none of the controls evaluated on the host passed. |
|
Tell me about compliance status (posture)Tell me about compliance status (posture) Possible values are: Passed - The expected value for the control matches the actual value returned during the last compliance scan on the host. Failed - The expected value for the control does not match the actual value returned during the last compliance scan on the host. PassedE - The host is exempt from the control. This means that an exception was requested and accepted for the control on the host. Error - An error occurred during control evaluation on the host. (Tip - Reporting options in user defined control settings allow you to ignore errors and show a different status.) |