Yes. Simply select Ignore from the Quick Actions menu and then select the Reactivate finding checkbox. Specify the number of days or a date after which the detection should reactivated again. Show me
Can we compare the results of findings between scan reports? |
|
Go to Reports and select New Report. Tell us which report you want to create and then identify the target of the report. We recommend you schedule reports (daily, weekly or monthly) to get fresh reports showing your current security status. It just takes a minute - go to Reports > Schedules and select New Schedule.
User roles and permissions determine whether users have WAS Reporting Permissions; these permissions include Create Report, Edit Report and Delete Report. To see a user's assigned user roles and scope, go to the Administration utility. You’ll see this option on the application picker. Learn more
Click the Edit Report button in the top right corner of the report. Use the wizard to change settings like the name, the report target, set filters and choose content. Once you click Save we'll create the report again with the new settings. (Tip - Turn on help tips in the title bar of the Report Edit window to view online help for each filter setting.)
The Results section shows you the vulnerability detection results in these categories: vulnerabilities, information gathered and sensitive content, if any. Click a vulnerability instance to display the detection details.
It's easy to remove certain detections from web application or scan reports using the ignore option. You'll select detections and mark them as false positive, not applicable or risk accepted. You can do this within a web application report/scan report or from the detections list. Learn more
It's easy to include ignored detections from web application or scan reports using the remediation filters. You can configure the filter in the report template or edit the web application report/scan report. Once you opt to include ignored findings in the report, you can further choose types of ignored findings:false positive, not applicable or risk accepted to be included in the report.
Can I schedule reactivation of a detection?
It's easy to include customized footer. Define the customized footer text in the report template and it will be displayed in the WAS reports: Web application report and scan report (HTML and PDF formats). You can use the report template when you generate the report to view the custom footer. Show me
Your web application report is interactive. You can edit the settings and filter the content to focus on the information that's currently most important.
- Click Edit Report in the header section and use the wizard to rename the report and apply content filters.
- Click Save and we'll re-run the report with your changes.
- Click the "New window" link in the report header to move the report to a new browser window. This makes side-by-side comparisons easy. It also increases the number of reports you can have open at one time.
Each report you create opens on its own tab in the Report Management window. You can download your open reports in multiple formats, and those reports are also saved to the reports list to be viewed and downloaded by authorized users.
Save and download an interactive report
Download a report from the Report List
Easy way to download datalists as reports
Your report will be saved in 2 places: 1) your report list, and 2) your local file system. Your report will be removed from the report list in 7 days (when it expires).
The user storage limit setting determines the maximum amount of WAS report data each user can save on our Cloud Platform. Did you see an error message when saving a report? We recommend you delete some existing reports and try again. Learn more
Report creation may sometimes fail if the report is created for large number of web applications. To avoid such failures, we have categorized report creation as per the number of web applications being included in the report. The categorization is as follows:
Number of Web Applications |
Online Report |
Download Report |
Less than or equal to 100 |
Yes |
Yes |
101 to 500 |
No |
Yes |
More than 500 |
No |
No |
For web applications less than or equal to 100, you can view the report on the UI as well as download it. For web applications in the range of 101 to 500, the report is not available online on UI but can be directly downloaded. But if the number of web applications exceeds 500, report cannot be generated and error message is displayed in such cases.
Yes, just click this icon ![]() in the report header to move the report to a new window of your browser.
Moving reports to separate browser windows enables you to do side-by-side
comparisons. It also increases the number of reports you can have open
at one time. All the interactive features of your report are available
in the new browser window.
in the report header to move the report to a new window of your browser.
Moving reports to separate browser windows enables you to do side-by-side
comparisons. It also increases the number of reports you can have open
at one time. All the interactive features of your report are available
in the new browser window.
There are multiple way to reproduce QID 150022. You could either use WAS Burp extension or use information provided in web application scan report.
In general, one of the easiest ways to reproduce a finding (including QID 150022) is by using the Qualys WAS Burp extension. With this you can import the exact request sent by WAS into Burp Repeater. Then you can manually test in real time (assuming you have access to the target web application or API) by sending the request and seeing the response.
Alternatively, you can try to reproduce to QID 150022 ("Verbose Error Message") using the information provided in the report details. We'll focus on two injection points: the Query-String and Form Inputs. Click here to learn more.
Tagging is a way of organizing reports, web applications and other configurations. When you download a report involving a tagged web application, you'll notice we suggest adding the web application's tags to the report. Tags are one of the many options we provide for filtering the report list. Tags also enable other users to access to your reports. Users whose scopes have tags in common with your reports can access those reports.
The OWASP Top 10 is one of the most common ways to categorize web application risks and vulnerabilities. The vulnerability detection in Qualys Web Application Scanning (WAS) are mapped to the 2017 edition of the OWASP Top 10.
The reports (web application, scan and scorecard) provide a graph listing the OWASP top 10 vulnerabilities. The Vulnerability Details in the report also provides a clickable link with OWASP details. You can click the link and view the further details about the vulnerability.
Yes, you can export the payload response to your local file system in HTML. Just click the Export icon in the Payloads section.

The preview pane appears under the reports list when you click anywhere in a report row. The report preview shows the title and type, the user who generated the report, the report status and report size in megabytes. Hover over the size to see the actual size in bytes. Click the Actions menu to take actions on the report. To download the report, click Download. You'll notice the Downloads field tells you the number of times the report has been downloaded by users in the subscription.

The security risk rating (high, medium, low) reflects the maximum severity level of all vulnerabilities included in the report. Ignored vulnerabilities are not included.
|
At least one non-fixed vulnerability with severity level 4 or 5 is included in the report. |
|
At least one non-fixed vulnerability with severity level 3 is included in the report, and no vulnerabilities with severity level 4 or 5 are included in the report. |
|
At least one non-fixed vulnerability with severity level 1 or 2 is included in the report, and no vulnerabilities with severity level 3, 4 or 5 are included in the report. |
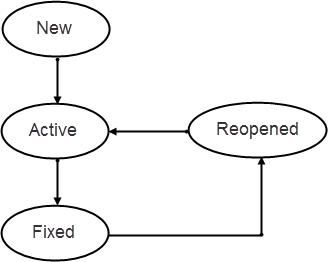
You'll see the status of detected vulnerabilities in the Results section of Web Application Reports and Scan Reports. We continuously update the status of detected vulnerabilities in your account, based on the most recent scan results.
Each vulnerability instance is assigned a status - New, Active, Fixed or Reopened.

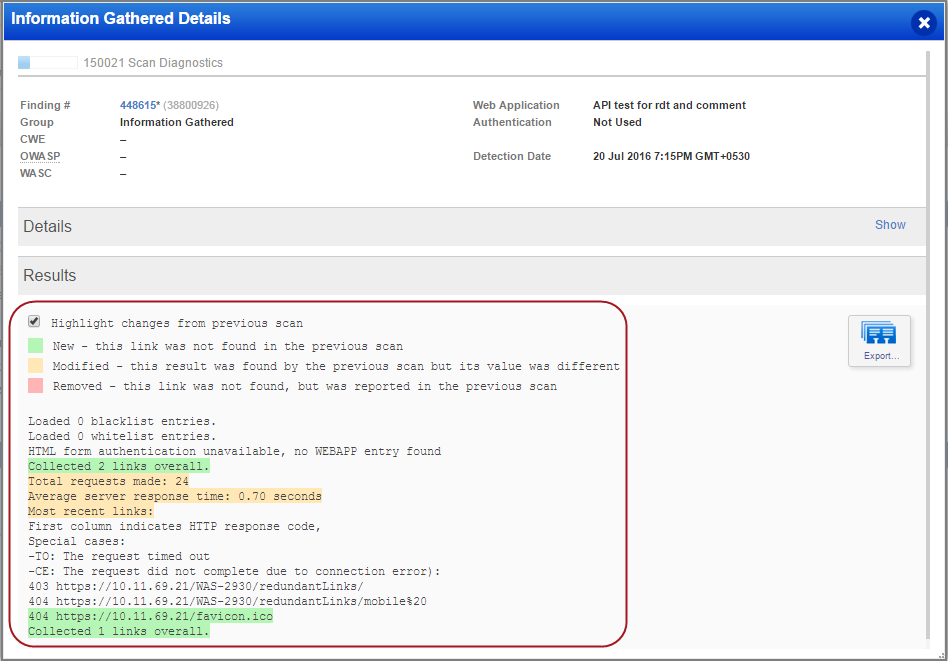
A comparative analysis of changes in scan results between incremental scan reports are also displayed in the Information Gathered details. When you expand the Results section you can see the changes from previous scans highlighted in multiple colors. Disable the Highlight changes from the previous scan option to hide the comparative analysis. By default this option is enabled.

It's easy to set a default format for downloading reports. Just edit your profile settings - select My Profile under your user name (in the top right corner).
In your scan settings enable the ScanTrust option to allow Qualys scanners to scan through the WAF and enhance assessment and reporting. Learn more
We provide you with complete and raw HTTP request for detections. The reports downloaded in PDF and HTML format also display complete and raw HTTP request for detections (except for Information Gathered (IG) vulnerabilities).
The WAS reports in PDF or HTML format displayed link, method, POST data, headers and snippets of the response body. The downloaded reports (PDF and HTML) also display full request headers and full request body for vulnerabilities. The complete requests and responses will help you to reproduce or validate the issue. Show me