Instrument container images with Qualys instrumentation
You have two options for instrumenting images:
Instrument images using CLI mode
Instrument images from the UI
This option uses the Instrumenter service. Once the Instrumenter service is up and running in your environment, you can instrument your images. Only images that have been scanned by a registry scan job (registry sensor) will have the Instrument option in the UI. To find the images you can instrument, go to Assets > Images and perform a search for images with REGISTRY as source.
Search query:
source: REGISTRY
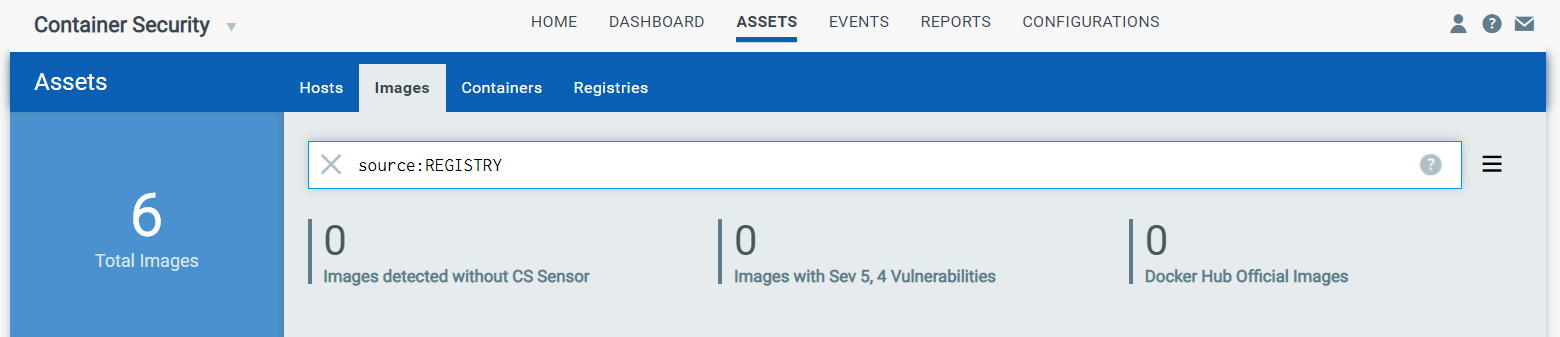
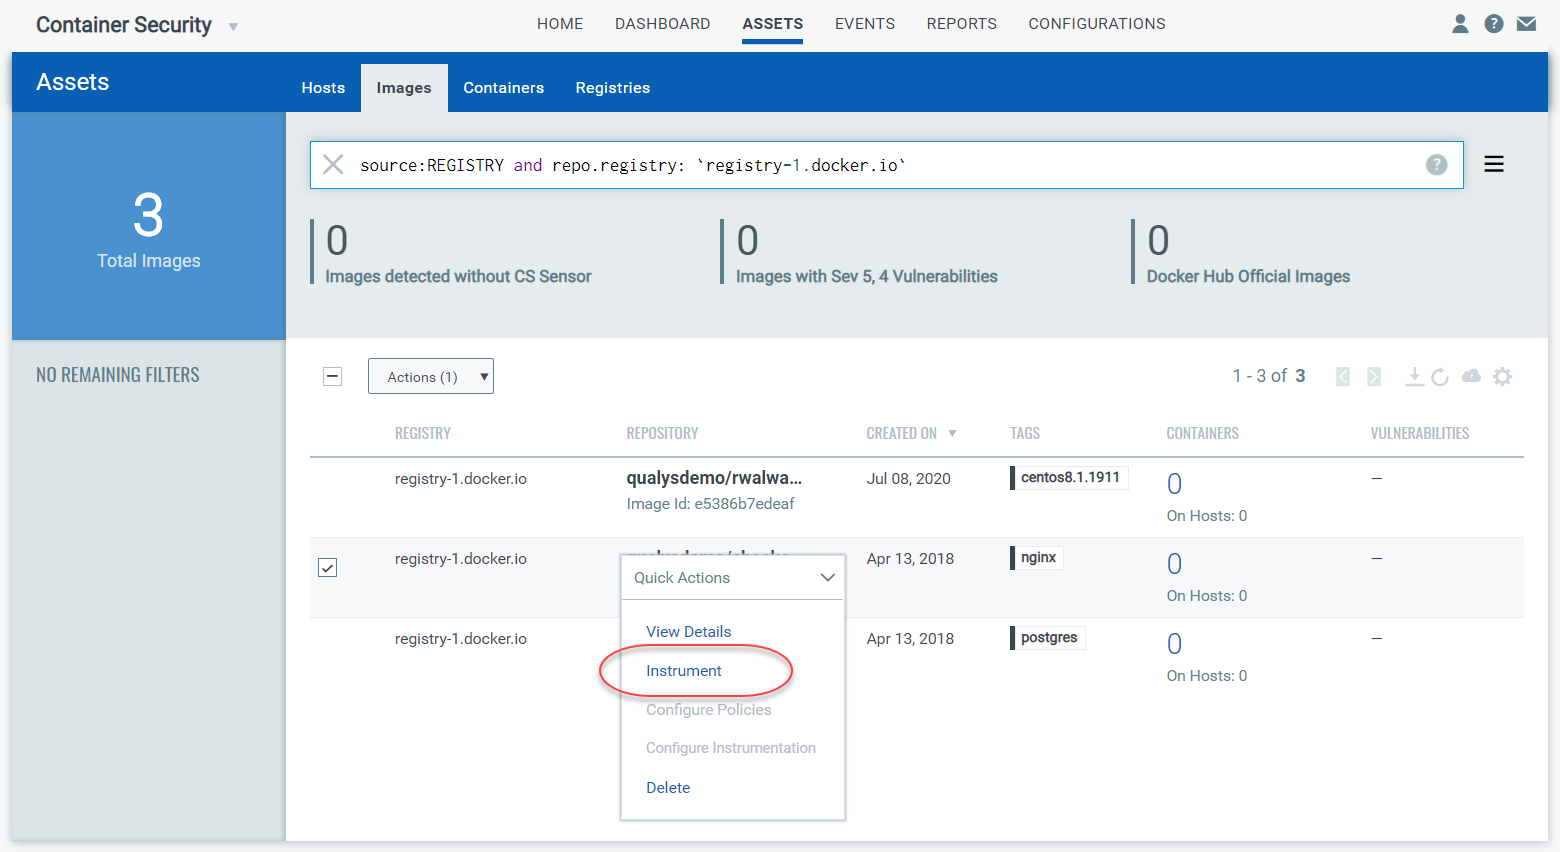
You can add additional search fields to help narrow down the list further. Then, in the search results, identify the image you want to instrument and pick Instrument from the Quick Actions menu.
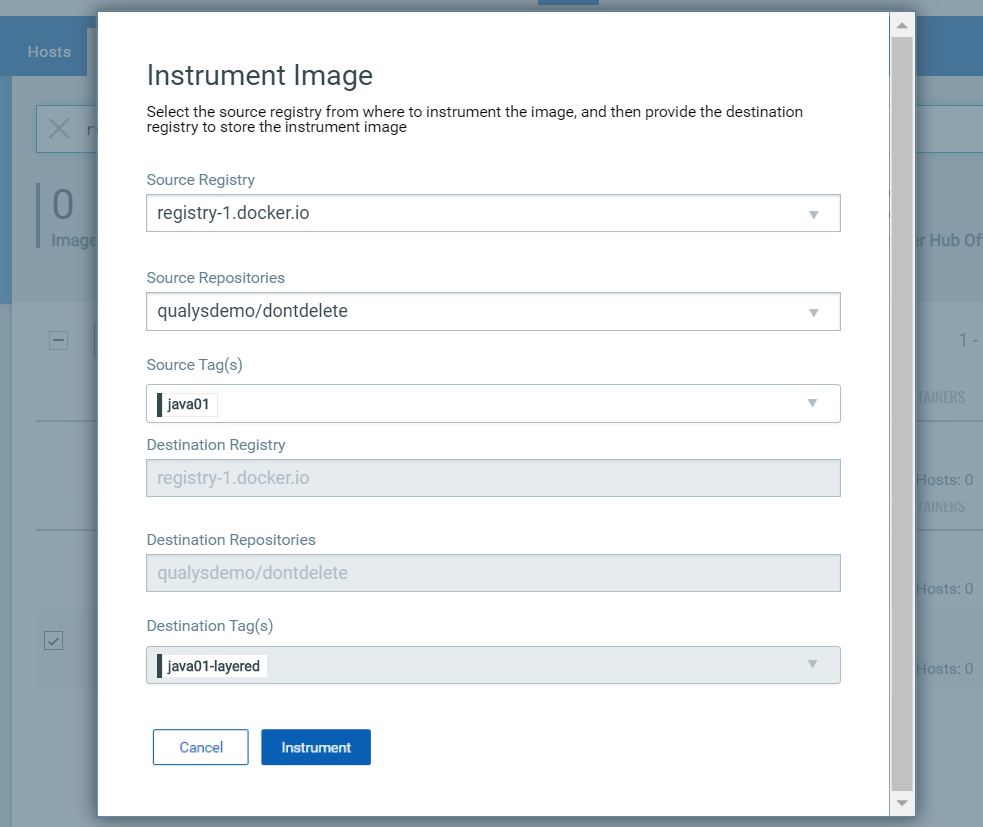
On the Instrument Image page, choose the source registry. You’ll notice that the destination registry has the same value as the source registry. Click the Instrument button.
What happens next?
The instrumenter service will pull the image down, add in our solution and push the image back to the destination registry.
Note the destination tags
Take note of the destination tag(s) assigned to the instrumented image. We take the source tag and append -layered to create the destination tag. For example, in the example above, you’ll see that the source tag is java01 and the destination tag is java01-layered. You’ll be able to search for instrumented images by the destination tag.
Instrument images using CLI mode
The Instrument option in the UI lets you instrument container images that have been scanned by a registry scan job (registry sensor). Use the CLI mode option to instrument any image on your local host directly without the need for a registry scan. The image is not pushed to any repository because the instrumentation happens locally, and the new -layered instrumented image will appear on the local machine and in the Container Security UI.
How it works
When you instrument an image using CLI mode, we’ll immediately add in our solution and create the instrumented image (appended with -layered) at the same location. One command will instrument one image only, and then it will exit as soon as the instrumentation is done. The instrumented image will appear in the Container Security UI where you can view details about it.
Using CLI mode
1) Pull the docker CLI files from github. You can download them from https://github.com/Qualys/qualys_crs_instrumenter
2) Edit instrumenter.sh to configure user specific details for proxy and vault usage.
3) Run the docker CLI script with the minimum required parameters. The script will run with CLI mode enabled by default. Required fields are endpoint and image. Policy ID is optional. (See Deploy the instrumenter service to learn about additional options.)
./instrumenter.sh --endpoint <endpoint> --image <image> [--policyid <policy id>]
For example:
./instrumenter.sh --endpoint "qualys_joe:my-password@https://gateway.qg1.apps.qualys.com/crs/v1.3" --image "6d9ae1a5c970" [--policyid "5fd20b4321dabf0001fdc464"]
Where:
<endpoint> is in the format of username:password@url if you are not using a vault. Only url is needed for the endpoint when you are using a vault.
<image> is the image Id (e.g. “6d9ae1a5c970”) or repository name:tag (e.g. “library/centos:centos72” or “java:latest”) for the container image you want to instrument. The image must be present locally where you’re running the CLI command.
<policy id> is the policy Id (e.g. “5fd20b4321dabf0001fdc464”) for the policy you want to immediately apply to the instrumented image.
Instrumented image in the UI
You’ll see instrumented images on the Assets > Images list. Note that for these images there is no value shown in the Registry column since these were instrumented on the local host using the CLI mode (not pulled from the registry). Also, these images have not been scanned yet so there are no vulnerabilities shown.
Run containers from instrumented image
Before you spawn up containers from an instrumented image, make sure you've completed these steps:
Apply policy to instrumented image
Configure instrumentation to select log mode
When ready, you can spawn a container from the instrumented image using the following command:
docker run -itd -e LI_MQURL=https://<cmsqagpublic VIP>/crs/v1.2 -e LI_MQSKIPVERIFYTLS=true <your registry/repo:tag>
The policy applied to the instrumented image gets enforced on the container and activities are logged as per the selected log mode.
View details for instrumented container
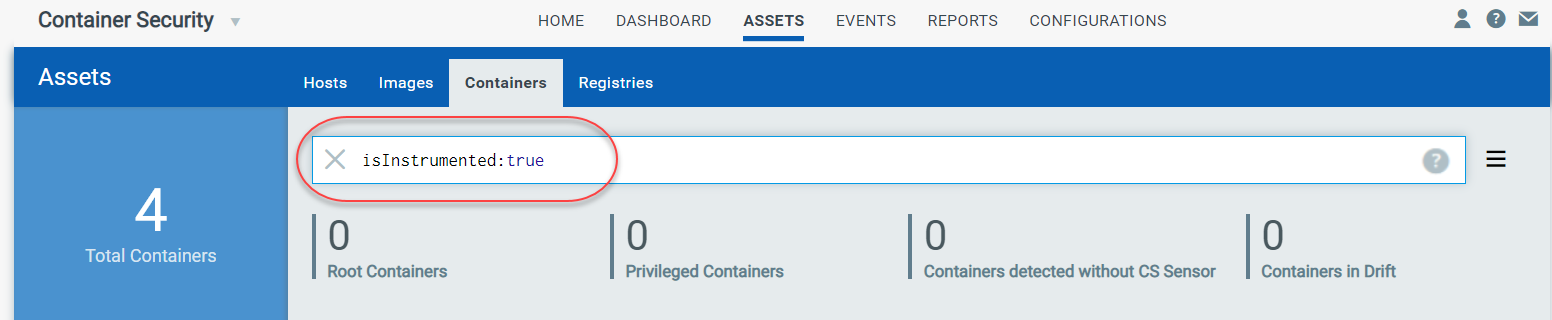
Go to Assets > Containers and perform a search using the following query.
Search query:
isInstrumented:true
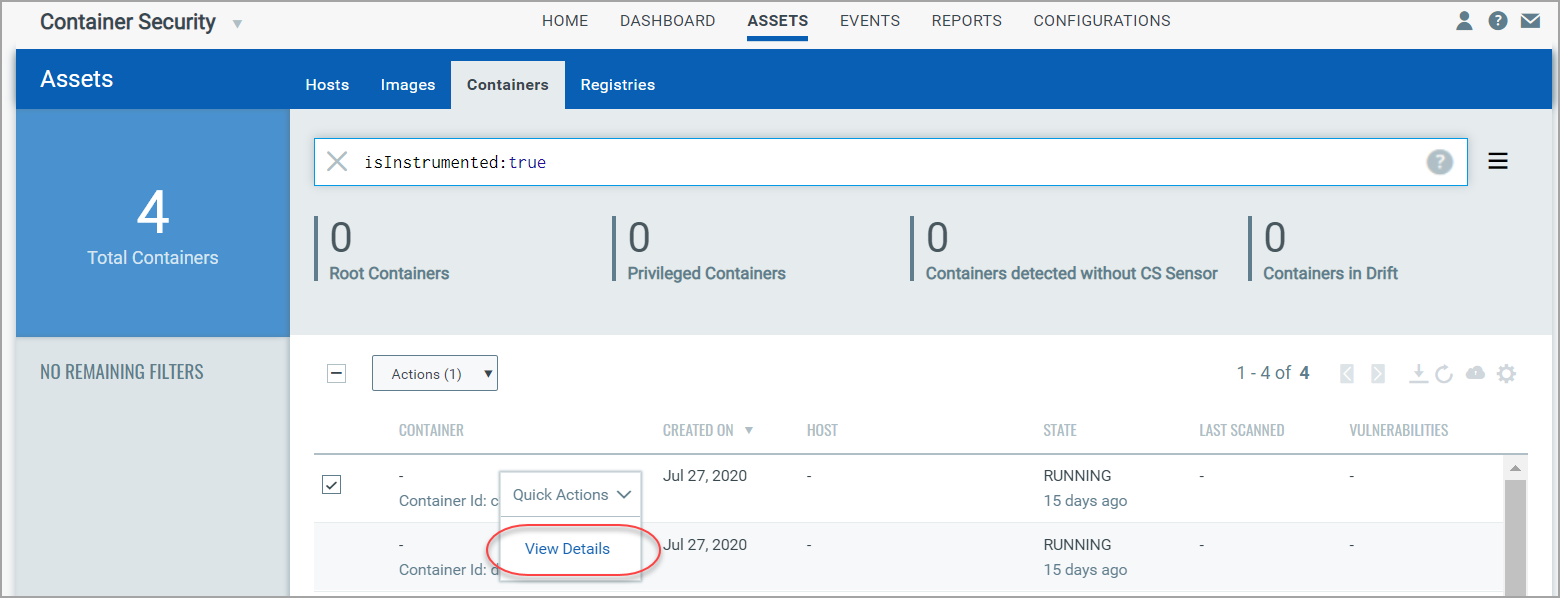
Then choose View Details from the Quick Actions menu for any container listed as a result of your search.
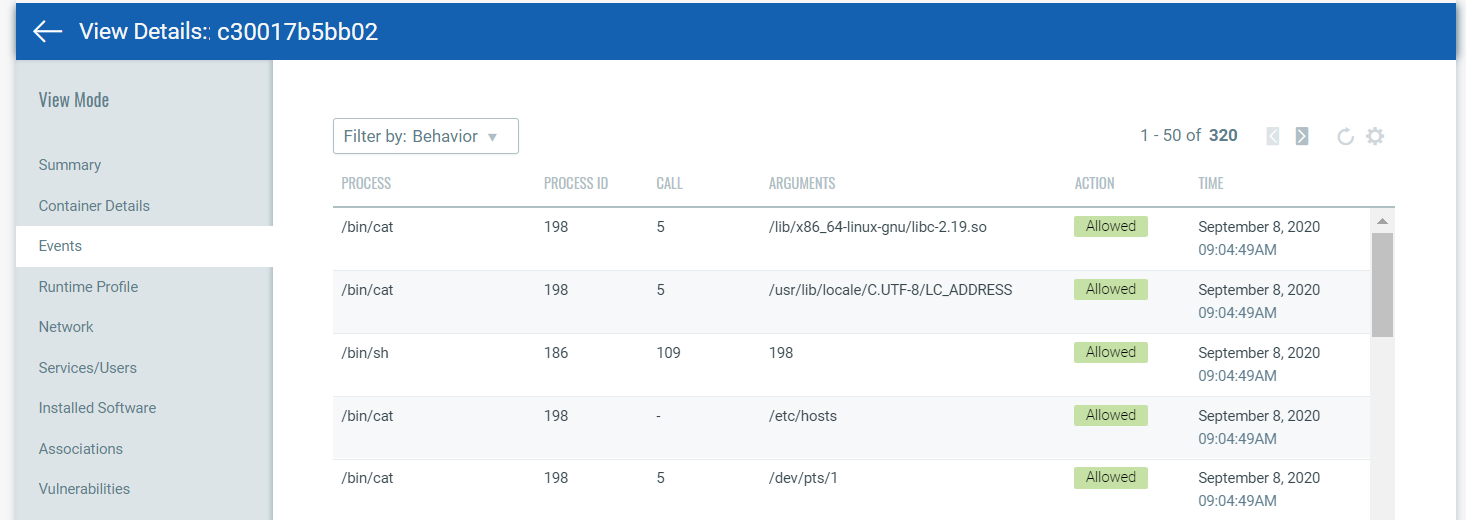
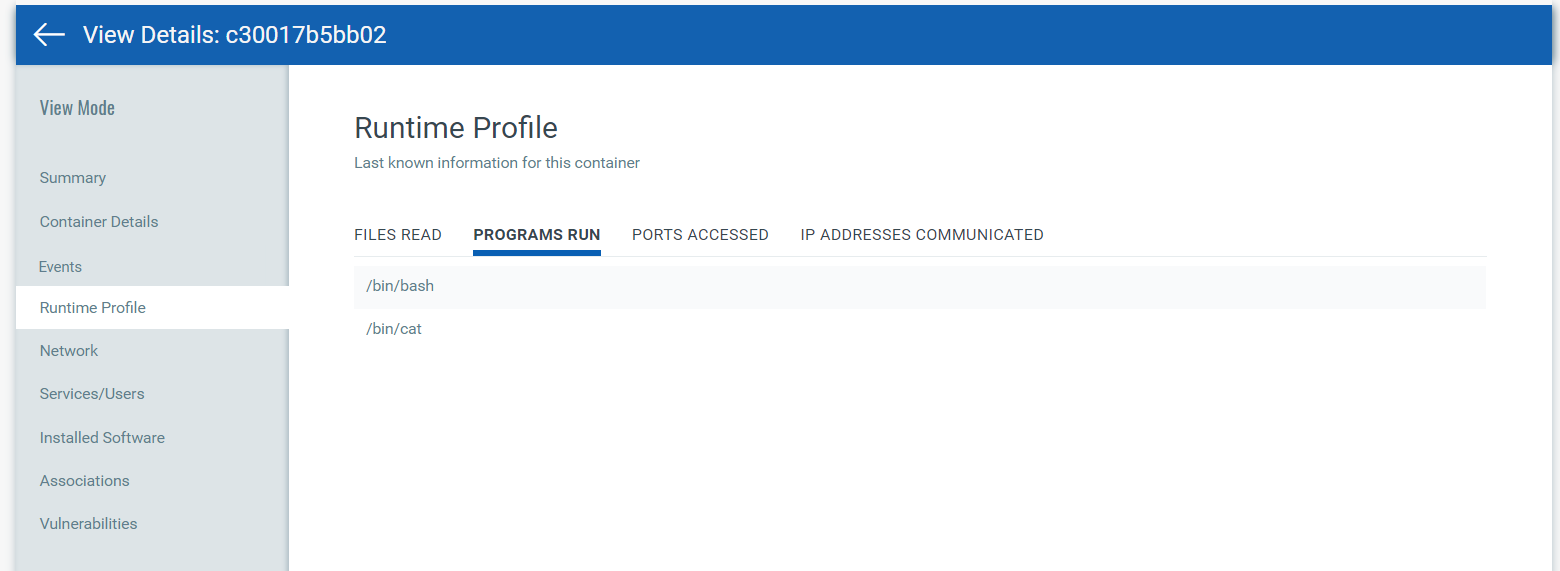
The Runtime Profile tab shows the resources that are tracked to gather trace information. It shows the files that are being read on the container, programs being run, ports accessed, and IP address information.
The Events tab shows runtime events, and whether the access was allowed, denied or monitored depending on the applied policy. Use the filter option to view standard logs or behavior logs. Standard logs show policy hits. Behavior logs show system calls. The system call number is shown in the CALL column.
Tip - Use the details you find here to configure policies.