 button. The
widget library is displayed.
button. The
widget library is displayed.Use average widgets to track the risk level for the number of days it took to close the vulnerability. The Mean Time To Remediation (MTTR) option is auto-selected in Select Field.
For example, you could calculate the average number of days it took to remediate vulnerabilities from their discovery dates.
Note: The Advanced Settings feature is disabled while using the Average widget.
Let us see the quick steps to build an average widget.
1. On the dashboard, click the
Add Widget button. The
widget library is displayed.
2. Click Build your widget.
3. On the right pane, select the Numerical widget.
4. On the left pane, select Vulnerability Management application.
5. Provide a name for the widget and enable the Show description on widget check box to display widget description.
6. Choose the Function Type as Average. The Fixed Age (MTTR) is selected by default.
Note: The Fixed Age (MTTR) is calculated using the Fixed vulnerabilities. Thus, the Excluded Vulnerabilities filter in the Query Settings does not apply to the Fixed status.
7. Choose Regular as Widget Representation.
8. Click the Query Settings.
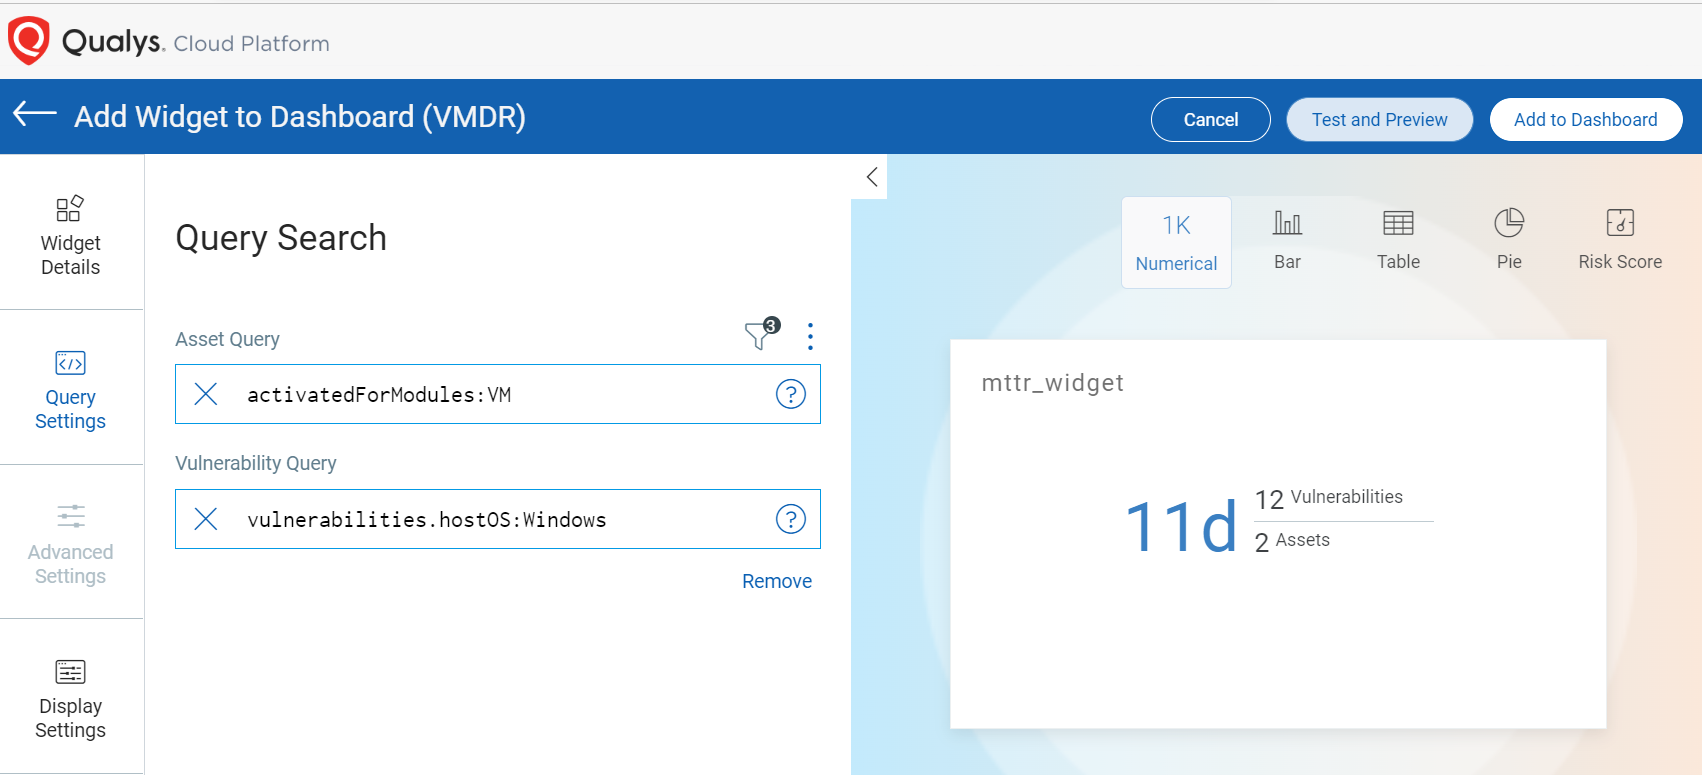
9. Add an: Asset Query and a Vulnerability Query. The widget result displays average of the number of days it took to fix vulnerabilities associated with assets that match the search query.
The following screenshot is an example of Average widget:
For information on search queries, refer to
Search Tutorial. Using the  search
action menu, you can view the frequently-used QQL queries, save, and manage
them with ease. Looking for the different actions on the search
queries, see Search Actions.
search
action menu, you can view the frequently-used QQL queries, save, and manage
them with ease. Looking for the different actions on the search
queries, see Search Actions.
You can view the preview of the widget and configure the parameters as per your requirement. Click Add to Dashboard to complete widget creation and view the widget on the dashboard.