In Policy Compliance, go to PC > Dashboard to see your dashboard. Depending on whether your account has been upgraded to the Enhanced Policy Compliance UI, you'll either see the New PC Dashboard or the Classic UI Dashboard. Both are described below.
To view the Security Configuration Assessment dashboard, go to SCA > Dashboard.
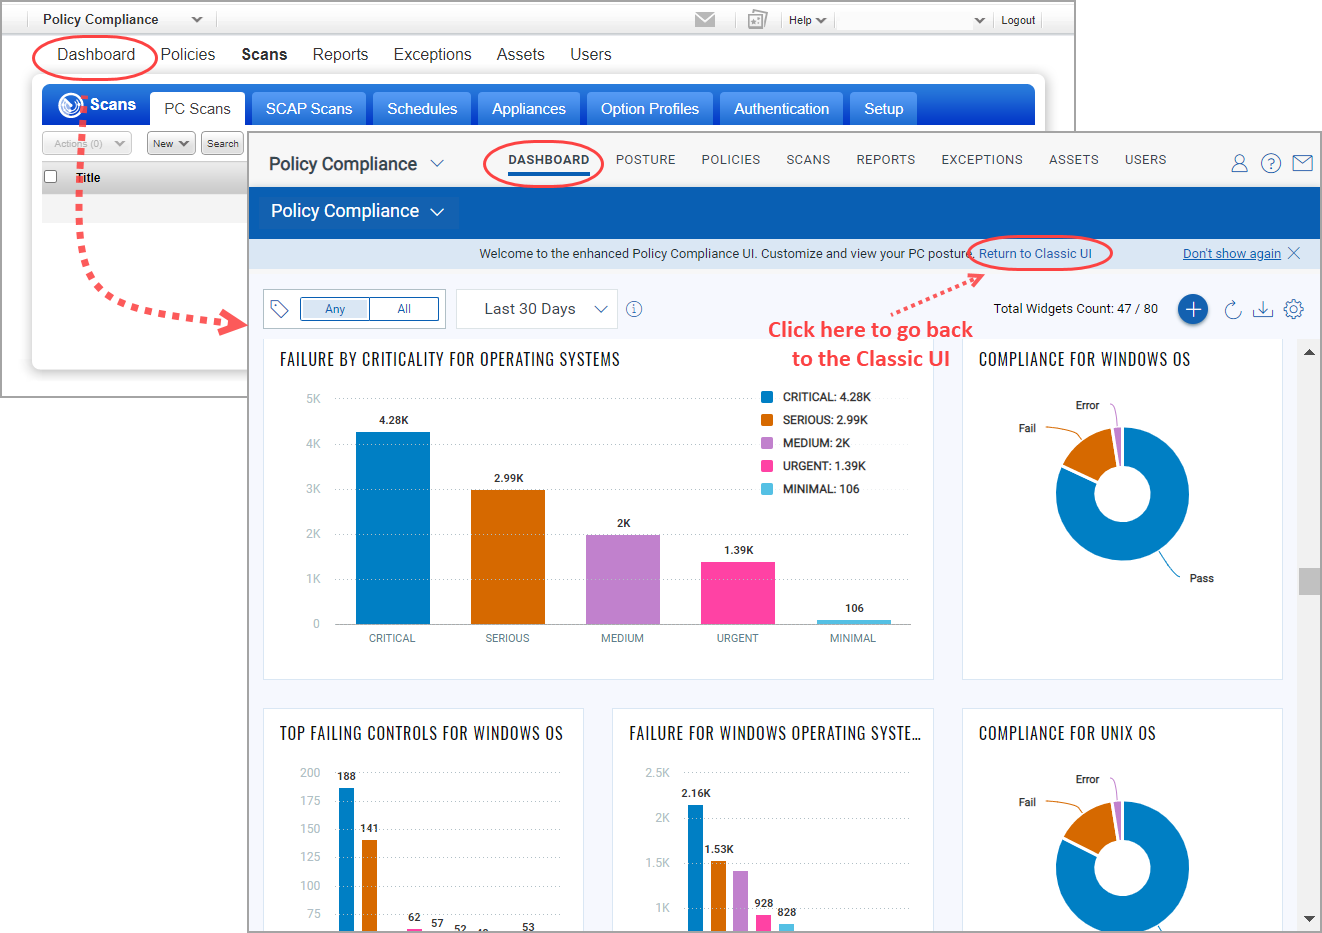
For subscriptions that have been migrated to the Enhanced Policy Compliance UI, go to PC > Dashboard and you'll get the new PC Dashboard. This replaces the Classic UI Dashboard in PC.
Please note that only PC assets/data will be migrated. If your subscription has both PC and SCA, your PC assets/data will be migrated but your SCA assets/data will not be migrated.
Want to go back to the Classic UI? No problem. Simply click the "Return to Classic UI" link and you’ll get your old dashboard back.
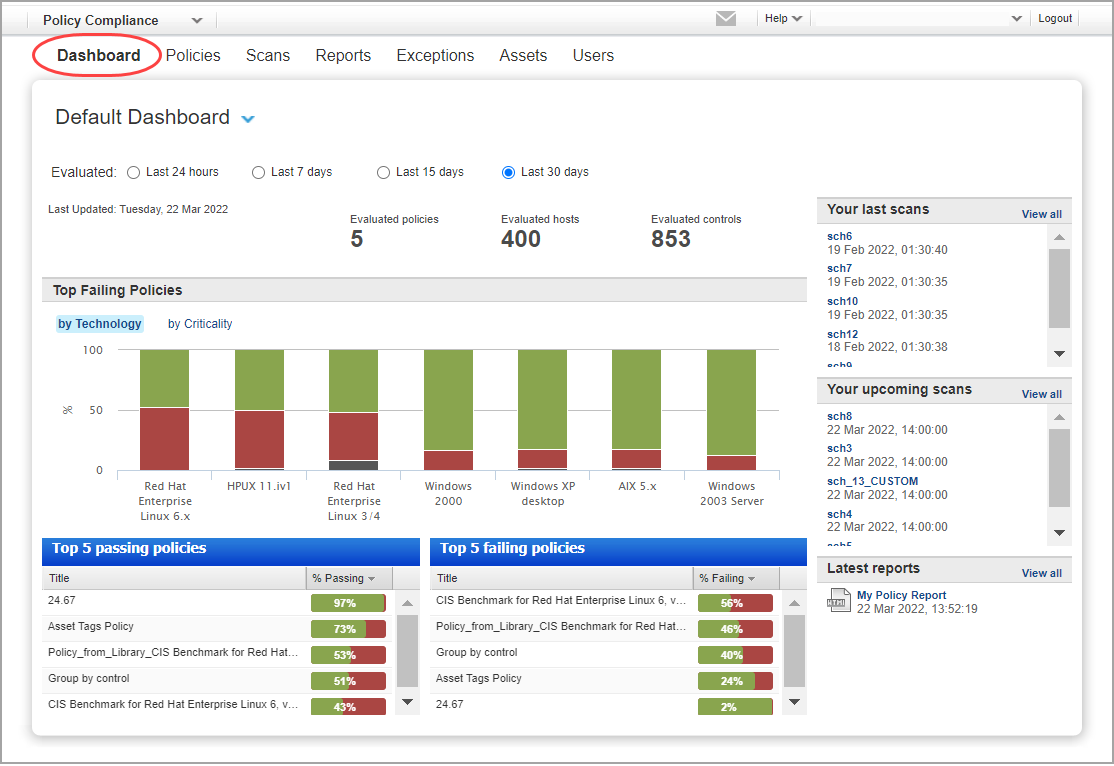
For subscriptions that have not yet been migrated to the Enhanced Policy Compliance UI, go to PC > Dashboard and you'll get the Classic UI Dashboard. You'll also see this dashboard if you were migrated but chose the "Return to Classic UI" option from the new PC dashboard.
The dashboard will only include controls that were evaluated in the selected timeframe. Choose one of these options next to Evaluated: Last 24 hours, Last 7 days, Last 15 days or Last 30 days.
This dashboard provides a one-page summary of your overall compliance status across all policies in your account (only CIS policies in case of SCA), based on the most recent compliance scan results. As new scan results become available, your dashboard is updated automatically.
Check out this video:
The top of the dashboard shows the total number of evaluated policies, hosts and controls in your account.
- A policy is counted if at least one control from the policy has been evaluated on a host.
- A host is counted if at least one control has been evaluated for the host.
- A control is counted if the control has been evaluated on at least one host.
Tell me about the top failing policiesTell me about the top failing policies
Get pass/fail statistics across all of the policies in your account broken down by technology or by criticality. Use the toggle to change your view.
by Technology - The top 10 failing technologies. Move your cursor along a technology bar to see the percentage of the evaluated controls for each compliance status (Passed, Failed and Error). The status Error is reported in cases where errors occur during evaluation of user defined controls.
by Criticality - This graph shows passed/failed statistics for each criticality level. If there is no control evaluation data for a particular criticality, then that criticality will not appear in the graph.
Simply double-click any policy under "Top 5 passing policies" or "Top 5 failing policies". The Policy Summary report appears with a summary of your compliance status for the selected policy. Learn more
Tell me about the last scans listTell me about the last scans list
You'll see the last 5 compliance scans, including scans that are running and finished with the most recent scan listed first. Select any scan title to view the Scan Status (for a running scan) or Compliance Scan Results (for a finished scan). Note - Readers and Auditors won't see the last scans list or the upcoming scans list.