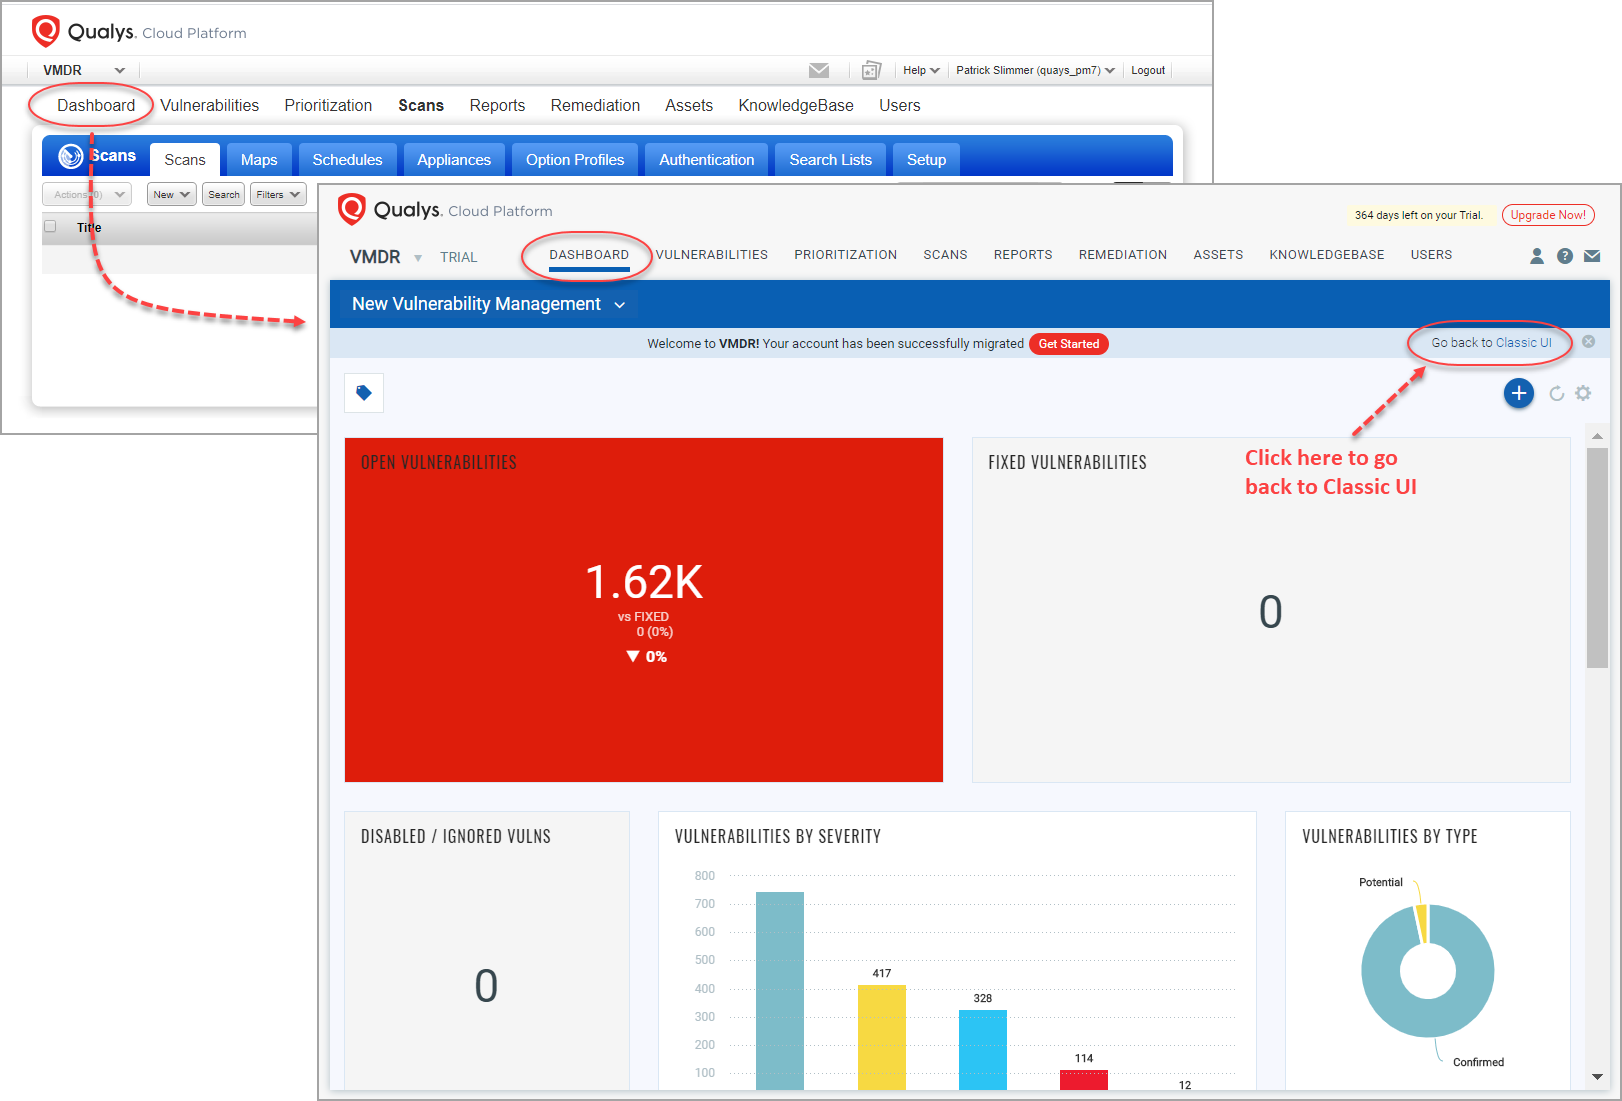
When your account is upgraded to VMDR, click the Dashboard option on the top menu and you’ll get the new VMDR Dashboard. This replaces the Classic UI Dashboard in VM.
Want to go back to the Classic UI? No problem. Simply click the “Go back to Classic UI” link and you’ll get your old dashboard back. This option is only available for accounts that were upgraded from VM to VMDR, not new accounts.
New VM/VMDR accounts get the VMDR dashboard by default.
Go to VM > Dashboard. You'll see the classic VM dashboard with a summary of your overall security posture based on the most recent vulnerability scan results.
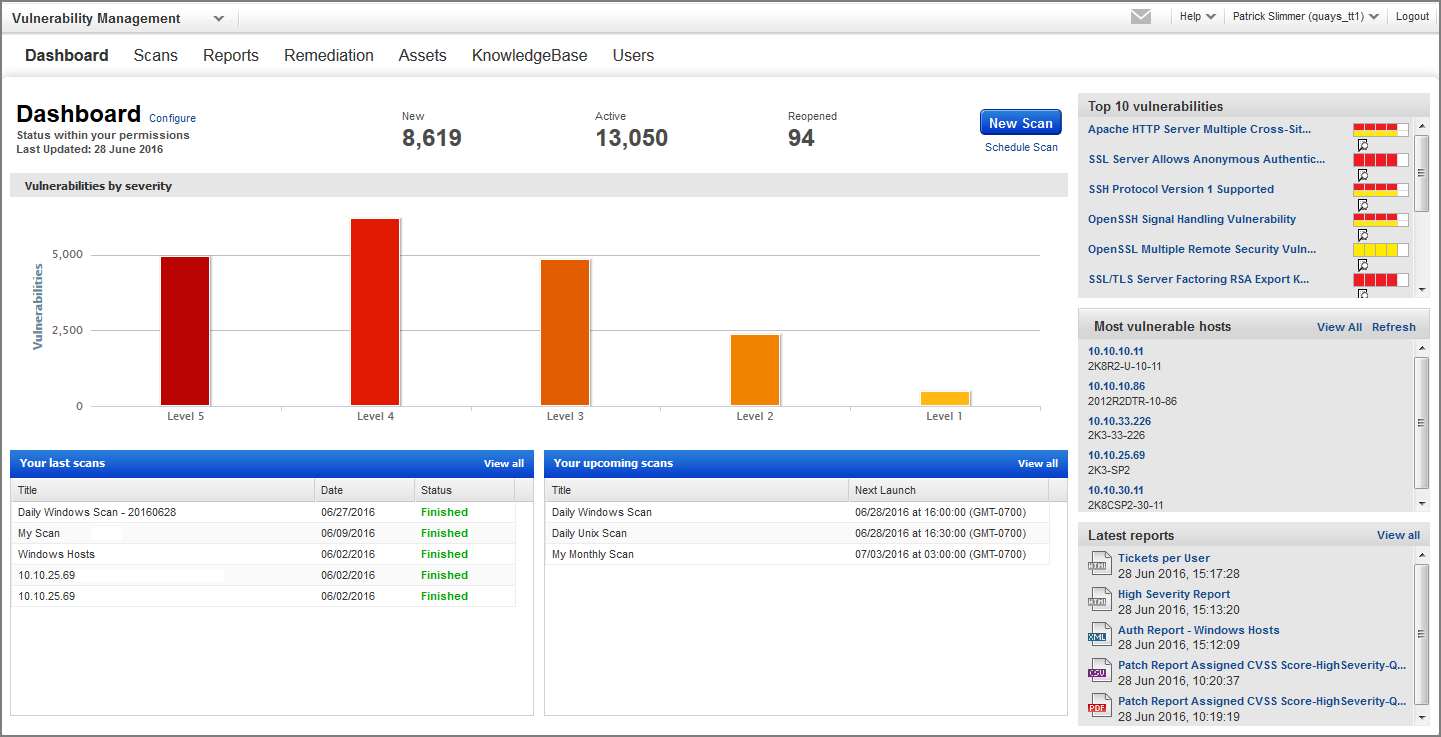
Click the Configure link to select the vulnerabilities and potential vulnerabilities you’re interested in. (Note that disabled and ignored vulnerabilities are not included in your dashboard.) Learn more
It's updated automatically as new scan results become available. You might want to start a scan from here (if you have scanning permissions). This is a convenient way to get the latest vulnerability data in your dashboard view.
Dashboards help you visualize your assets, see your threat exposure, leverage saved searches, and fix the priority of vulnerabilities quickly.
We have integrated Unified Dashboard (UD) with VMDR. UD brings information from all Qualys applications into a single place for visualization. UD provides a powerful new dashboard framework along with platform service that will be consumed and used by all other products to enhance the existing dashboard capabilities.
You can use the default VMDR dashboard provided by Qualys or easily configure widgets to pull information from other modules/applications and add them to your dashboard. You can also add as many dashboards as you like to customize your vulnerability posture view. Learn more.
Tell me about the counts for New, Active, ReopenedTell me about the counts for New, Active, Reopened
The top of the dashboard shows the total number of vulnerabilities and potential vulnerabilities by status: New, Active and Reopened.
This bar graph displays the total number of vulnerabilities (and potential vulnerabilities if selected) detected at each severity level. Configure the dashboard to change the severity levels included in the graph.
What are the Top 10 vulnerabilities?What are the Top 10 vulnerabilities?
You can configure your dashboard to show the Qualys top 10 lists of vulnerabilities. And you can also shown your own top 10 list. Click the title for any vulnerability in the list to see vulnerability details and verified fixes.
Qualys continuously updates the top 10 internal and external vulnerabilities lists, from a statistically representative sample of thousands of networks.
- The top 10 external vulnerabilities are those most often detected on public IP addresses.
- The top 10 internal vulnerabilities are those most often detected on private IP addresses.
What are the Most Vulnerable Hosts?What are the Most Vulnerable Hosts?
This is a list of the 5 most vulnerable hosts in your account based on the latest vulnerability information.
- Click View All to see a list of all hosts in your account with vulnerabilities.
- Click the IP address for any host in the list to see host information.
You can configure the dashboard to determine which hosts should be considered for this list. Set the minimum business impact level, the minimum security risk (the highest severity level detected on the host), and the timeframe in which the host was last scanned (up to 30 days). Learn more