You might not have vulnerability counts yet. All you have to do is add a web application and then launch a vulnerability scan to get started.
Custom dashboards let you focus on certain web applications and production environments.
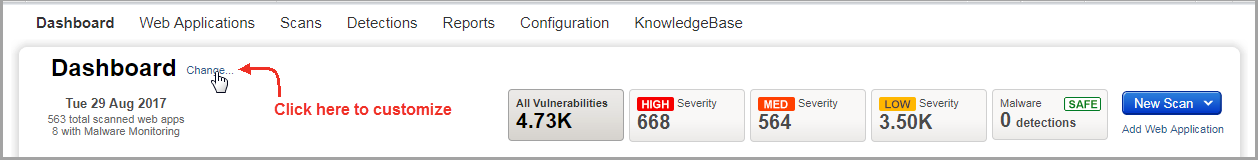
Want to create a custom dashboard? Just hover over "Dashboard" and click Change...
This is the current total number of vulnerabilities detected on all your web applications.
- High Severity shows number of those assigned severity levels 4 and 5
- Med Severity shows the number assigned severity level 3
- Low Severity shows the number assigned severity levels 1 and 2
Tip - Click any of these tiles to go to the detections list filtered to your selection
The number of malware detections found on web applications will be shown, when Malware Monitoring is enabled in web application settings and malware is detected.
Tip - Click this tile to go to your Malware Detection Service dashboard.
These are your most vulnerable web applications in order of the highest detected risk level. You can take actions on a particular web application in the list. Hover over a web application row and select an action from the Quick Actions menu. Click "View all" to go to web applications list where you can manage your web applications.
Your catalog includes your web applications discovered by your VM maps and scans. The pie chart shows the number of web applications in your network by status: New, Approved, In Subscription, Rogue and Ignored.
Click "View all" to go to your catalog.