Qualys Insights
Qualys Insights consolidates malware detection data from Endpoint Detection and Response (EDR) application. Using this data, you can get the list of assets that are affected with the malware and take appropriate actions on the affected assets. Qualys Insights is available for the Assets and Vulnerability field in the Vulnerabilities tab. The Insights displays the TruRisk Score for Assets and Qualys Detection Score (QDS) for Vulnerability.
The following conditions should be met to view Qualys Insights:
- VMDR Full subscription
- EDR module should be enabled. Contact Qualys Support to enable the EDR module.
Perform the following steps to view Qualys Insights:
1. In VMDR, click the Vulnerabilities tab.
2. Click View Qualys Insights or Toggle Graph ![]()
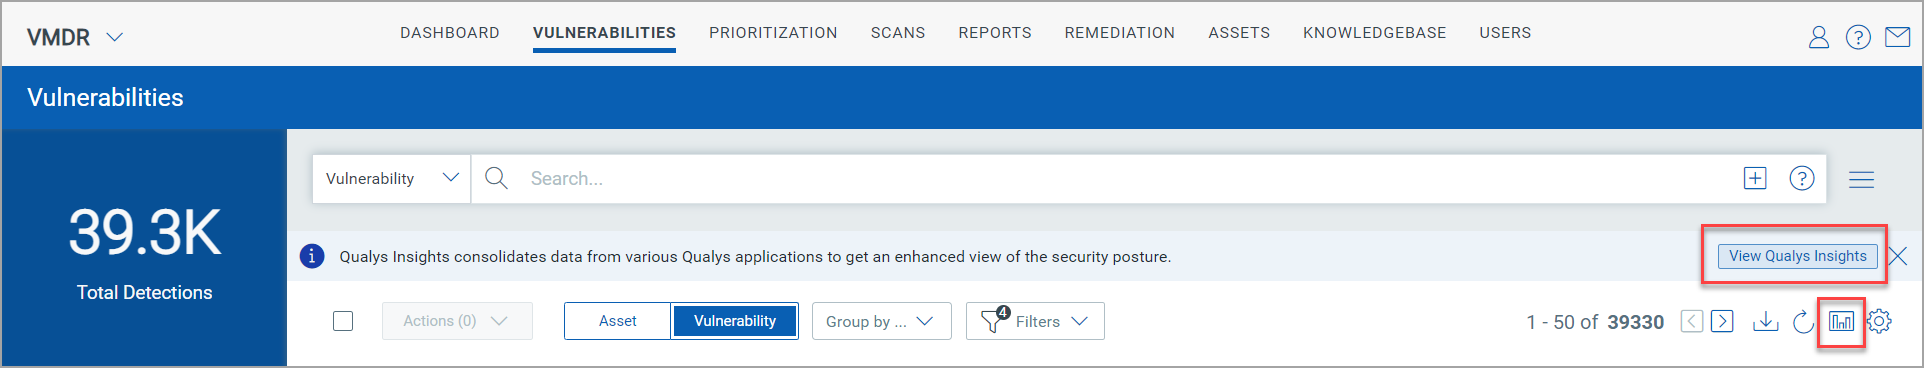
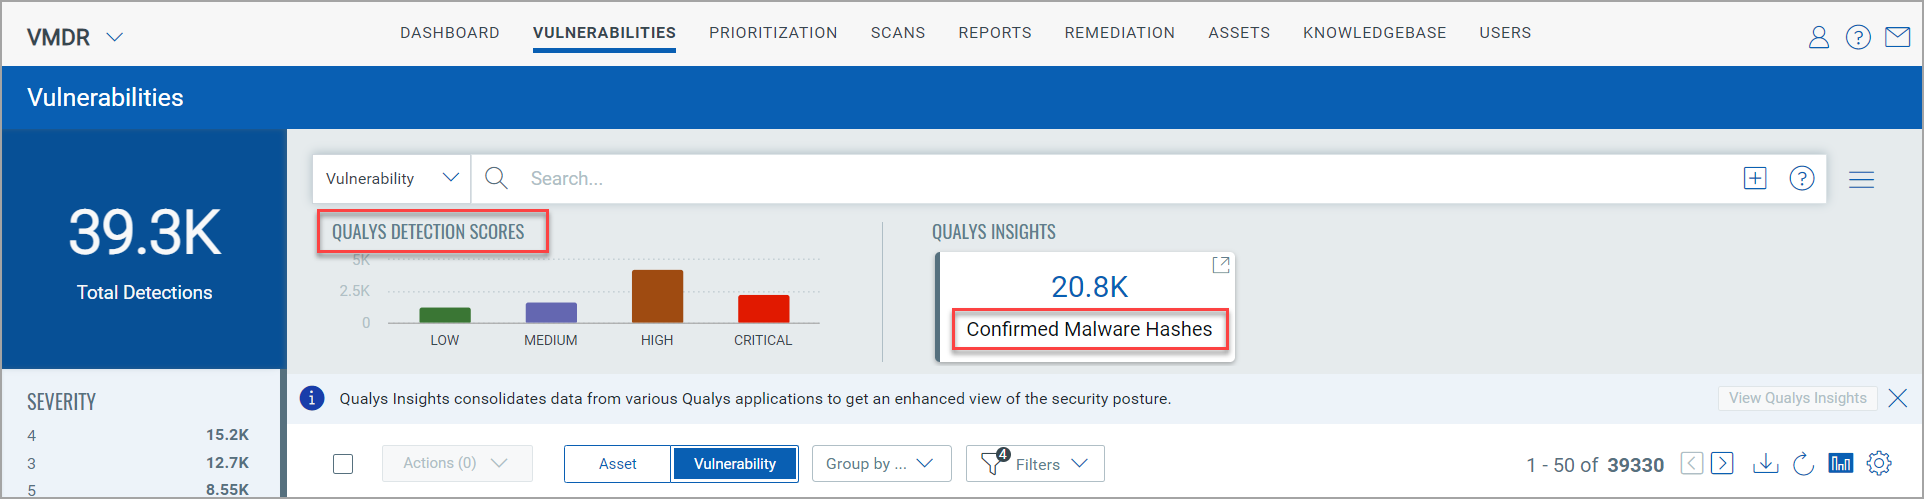
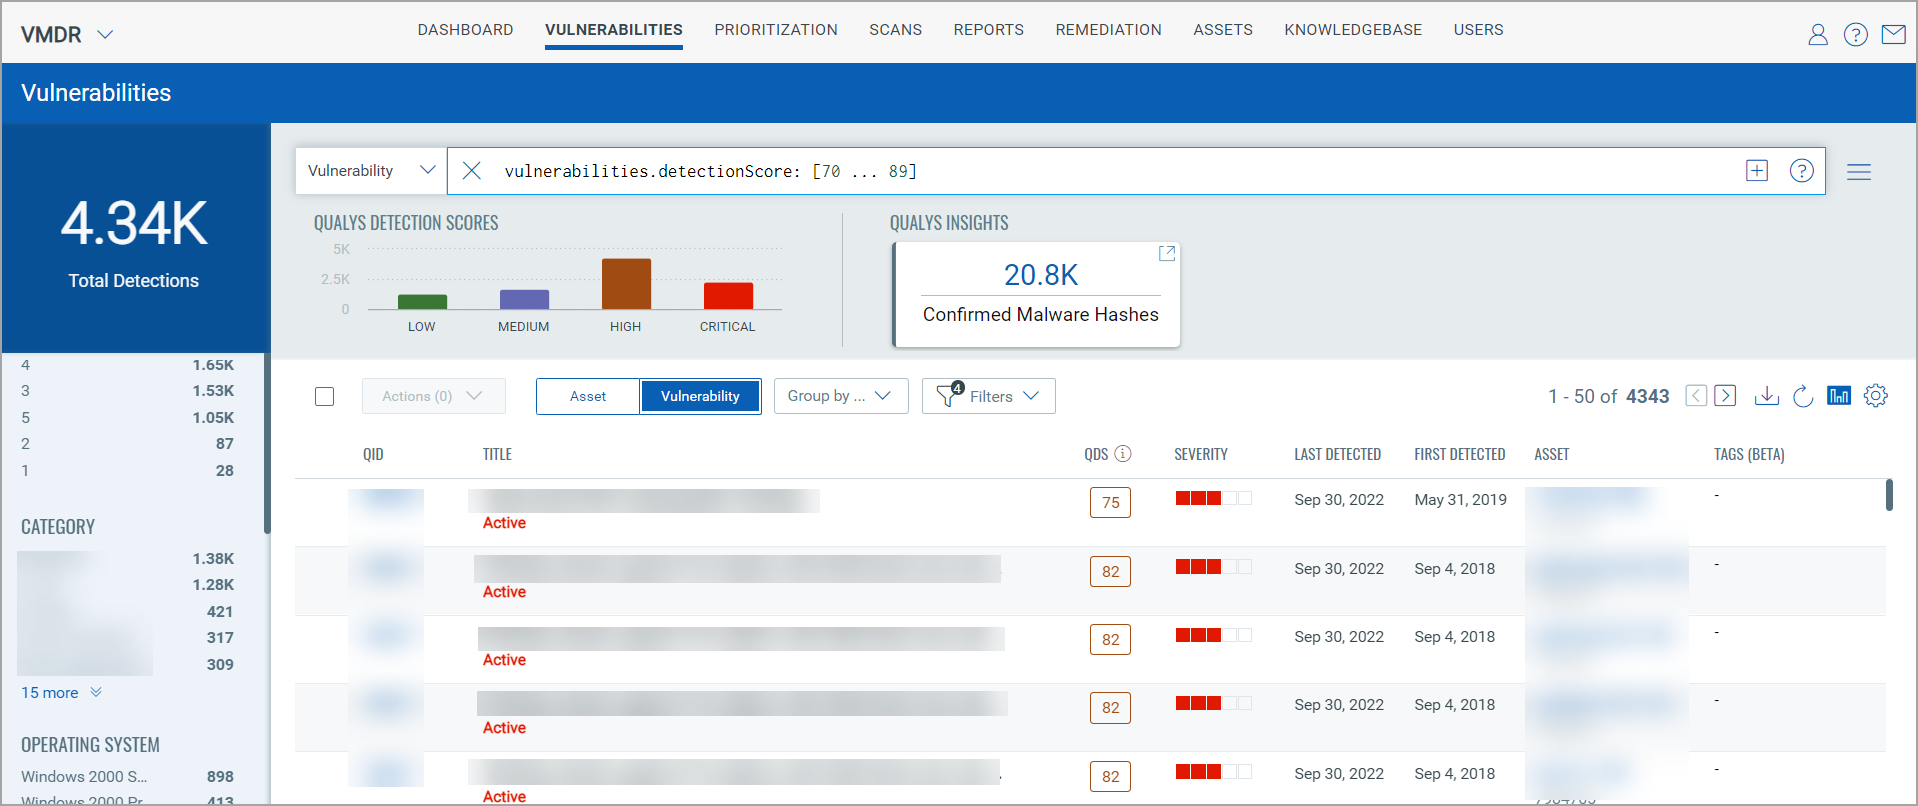
If the search is for Vulnerability, Qualys Insights displays Qualys Detection Score (QDS) and Confirmed Malware Hashes. Following is an example of QDS with Confirmed Malware Hashes:
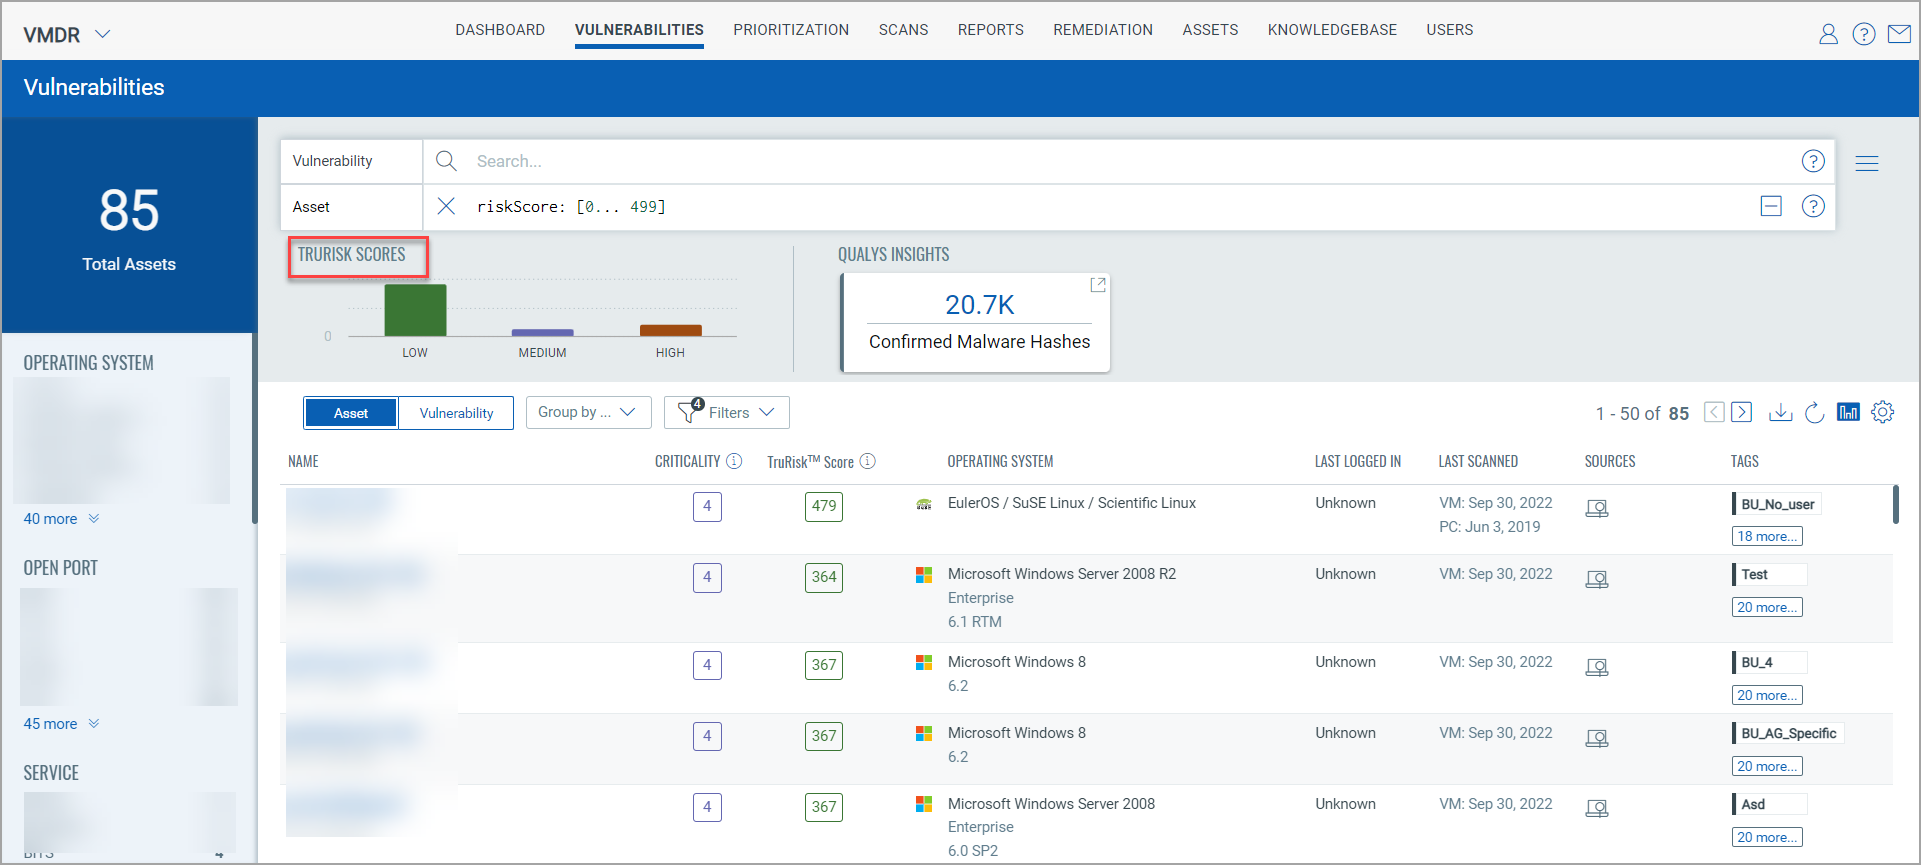
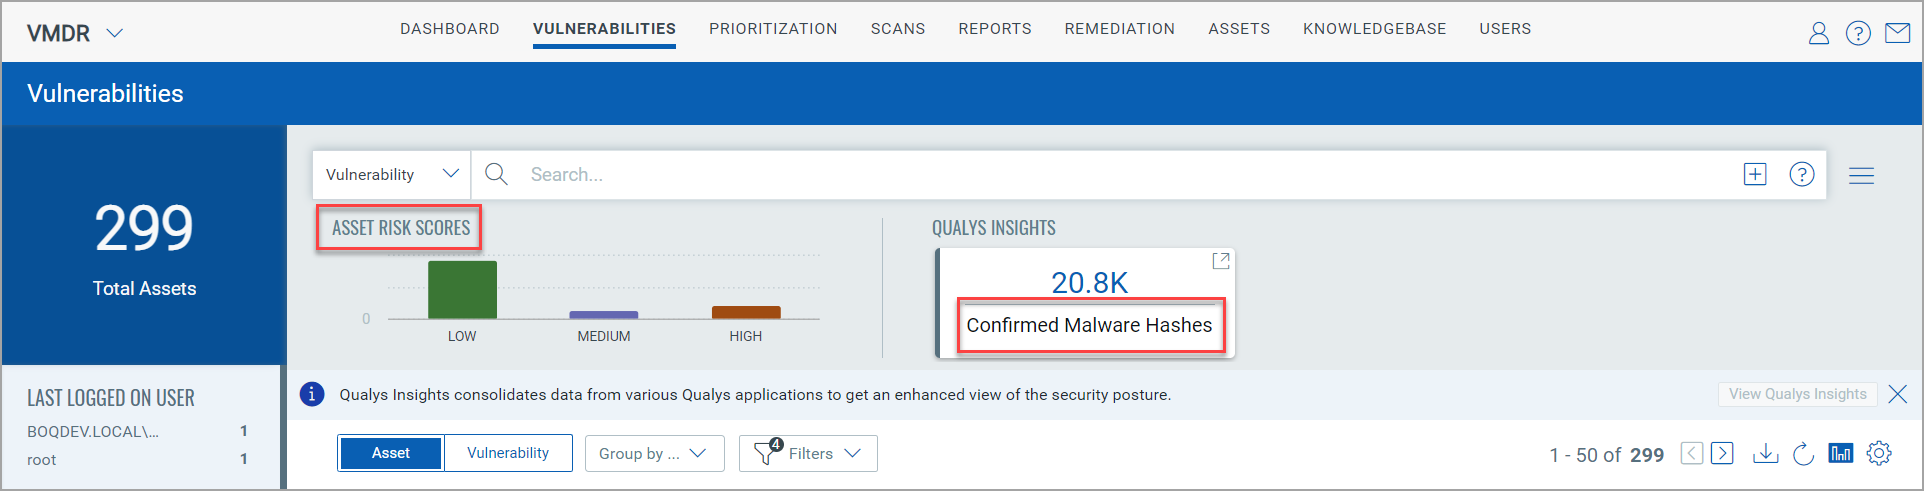
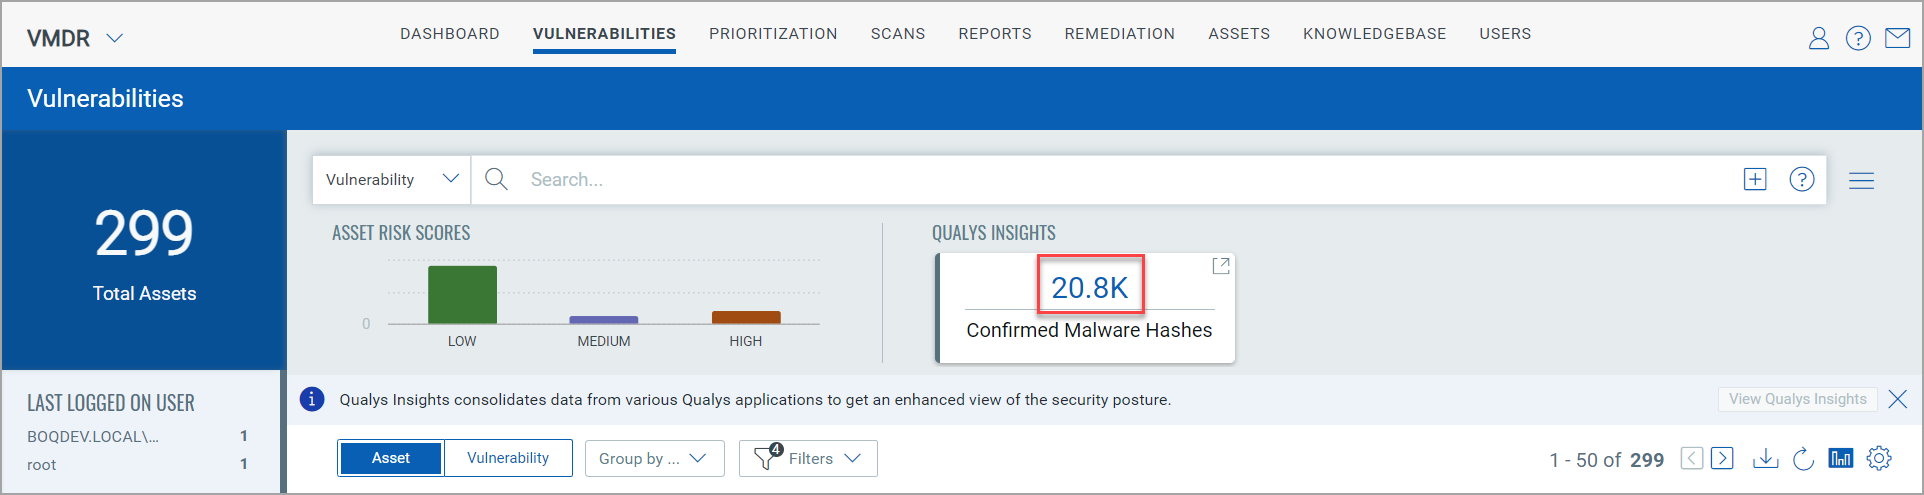
If the search is for Assets, Qualys Insights displays TruRisk Score and Confirmed Malware Hashes. Following is an example of TruRisk Score with Confirmed Malware Hashes:
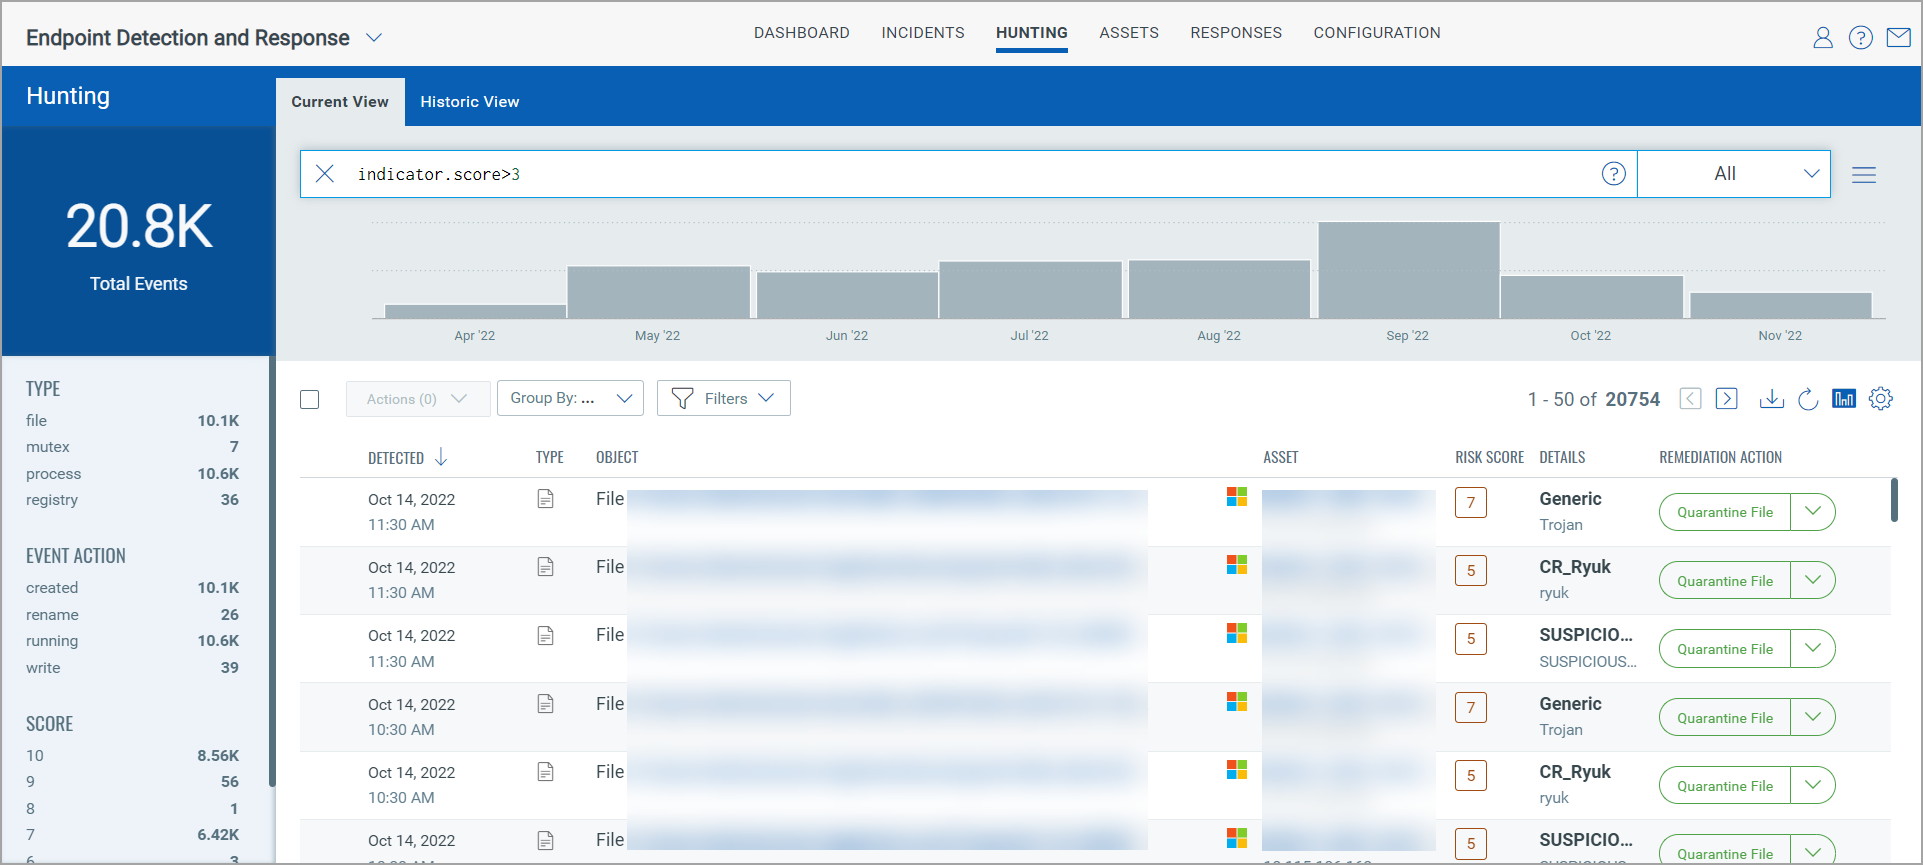
3. Click the value of Confirmed Malware Hashes, and you will be redirected to Endpoint Detection and Response (EDR) page.
The Huntings tab in the EDR module lists the files affected by malware and the asset name.
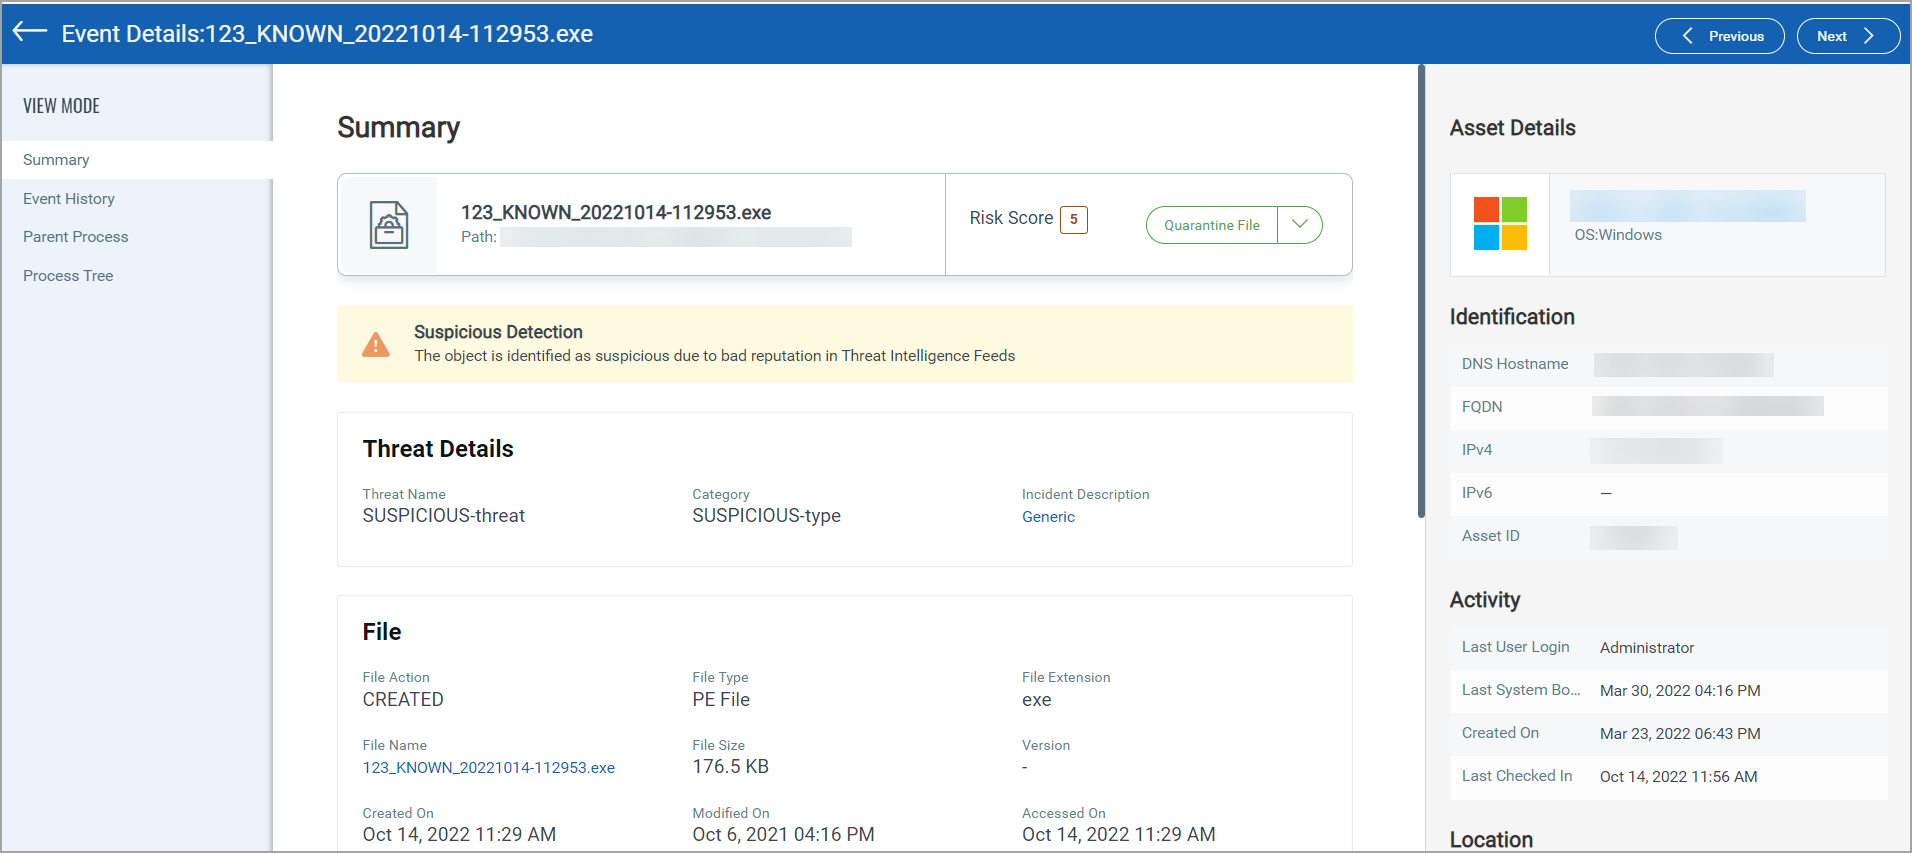
4. Click on the File name to view the event details.
View Qualys Detection Score (QDS) using Qualys Insights
Perform the following steps to view list of QIDs using the Group by field:
1. In the Group by field, select QDS Range. The list displays the Vulnerability Count for each QDS Range.
2. Click the vulnerability count of the respective QDS to view the list of QIDs.
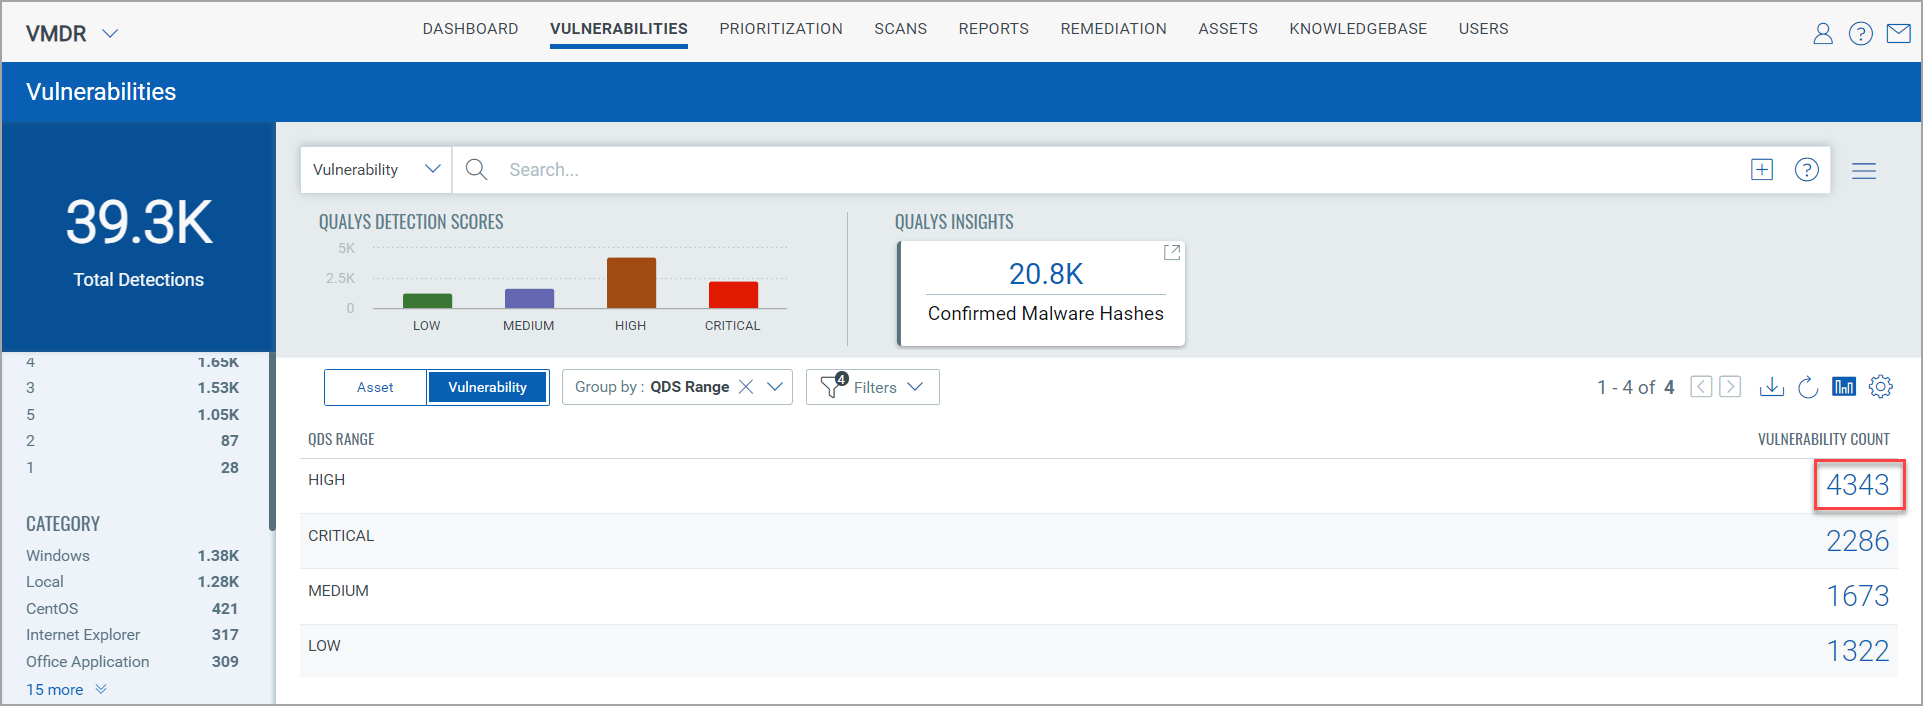
For example, in the following screenshot, when you click on the vulnerability count for High QDS, the list of QIDs is displayed:
View TruRisk Score using Qualys Insights
Perform the following steps to view TruRisk Score Range using the Group by field:
1. In the Group by field, select TruRisk Score Range. The list displays the Asset Count for each TruRisk Score.
2. Click the asset count of the respective Trurisk Score Range to view the list of assets.
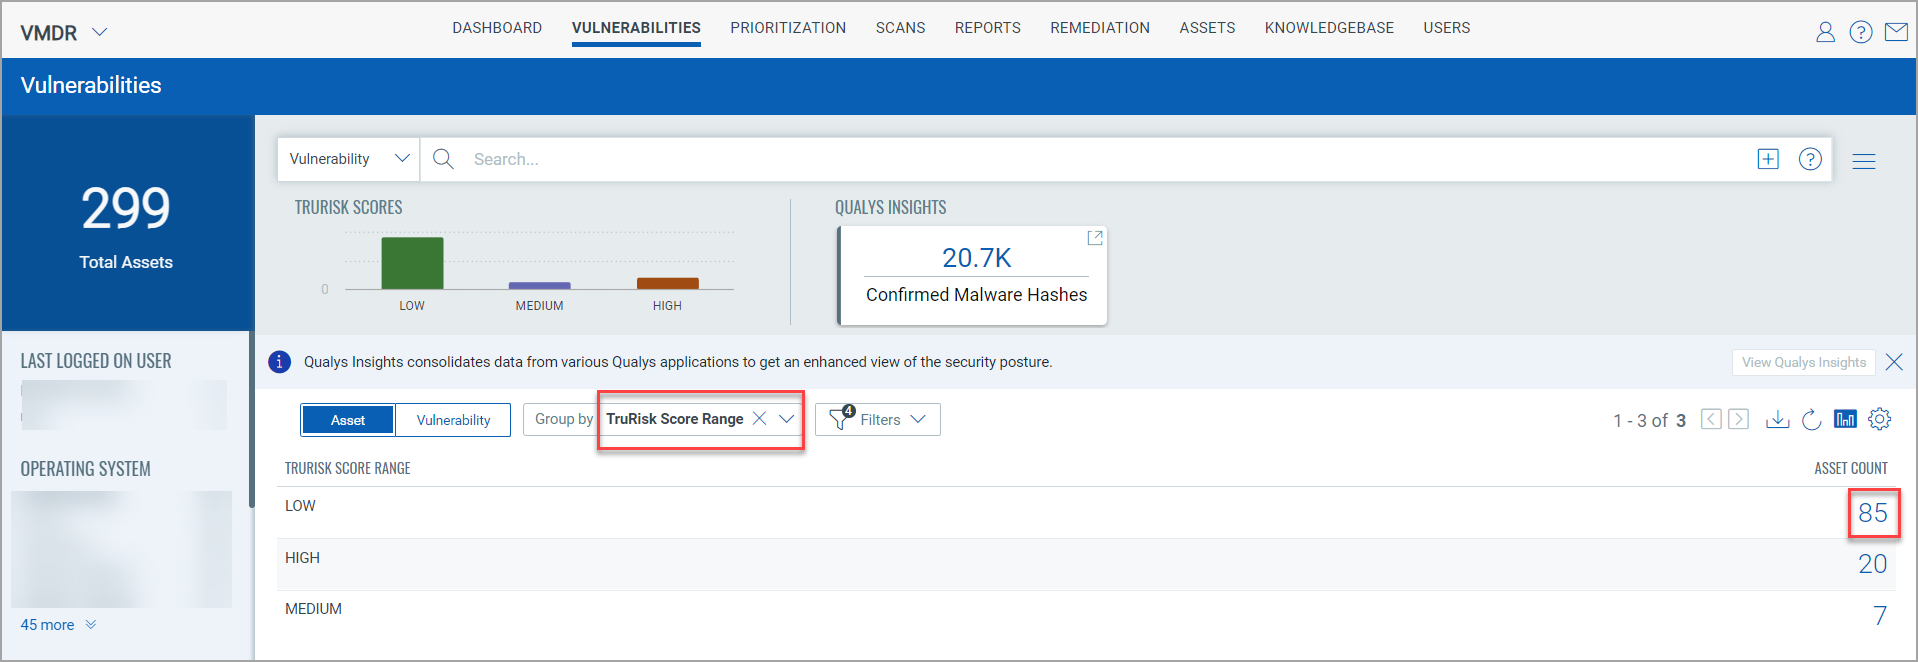
For example, in the following screenshot, when you click on the asset count for Low Trurisk Score, the assets list with low TruRisk Score is displayed: