button. The widget library is displayed.
You can visualize, consolidate, and communicate multiple data points through a single widget using simple list table widget. You could add multiple attributes for a vulnerability or asset (search results) to be displayed as different columns in the table.
Let us see the quick steps to build a simple list table.
1. On the dashboard, click the Add Widget button. The widget library is displayed.
2. Click Build your widget.
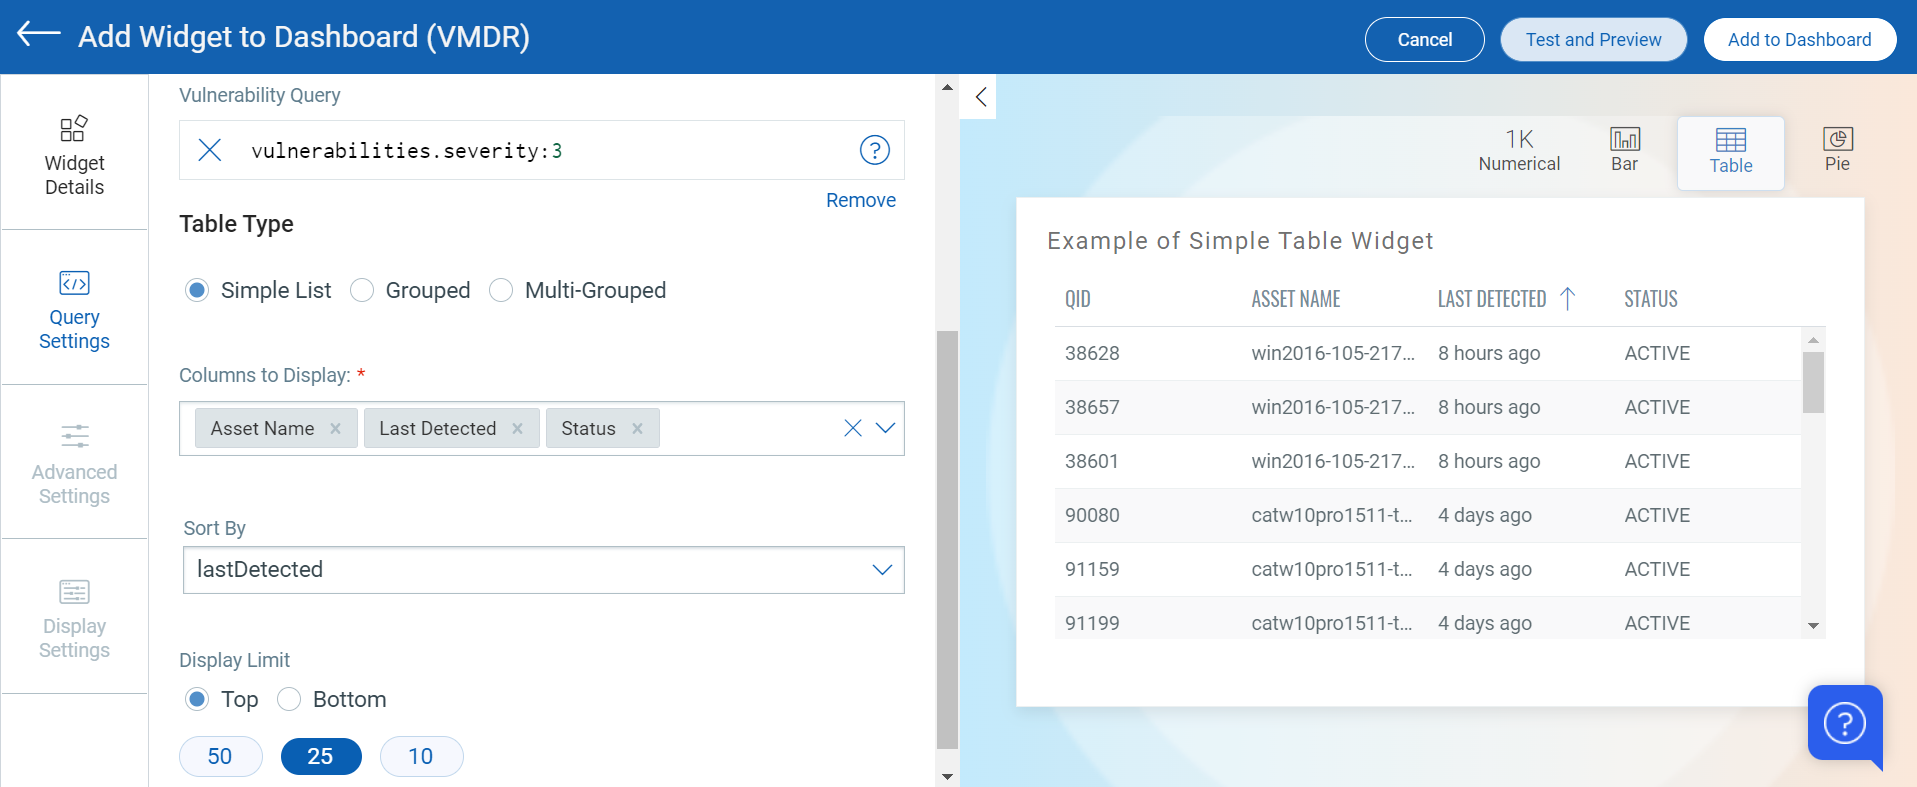
3. On the right pane, choose the Table widget Type.
4. On the left pane, select Vulnerability Management application.
5. Provide a name for the widget.
6. Select the Show description on widget check box to display the widget description on the dashboard.
7. Click Query Settings.
8. Choose the Display result as: Vulnerability or Asset. The widget result depends on the data set the you select. If you choose Assets, the widget displays the count of assets that match the search query. If you choose Vulnerability, the widget uses the count of vulnerabilities that match the search query.
9. Based on your preference, add an asset or vulnerability query that you want to populate in the widget. For information on search queries, refer to Search Tutorial. Using the  search action menu, you can view the frequently-used QQL queries, save, and manage them with ease. Looking for the different actions on the search queries, see Search Actions.
10. Columns to Display: Select the data parameter to be fetched and displayed as columns in the table. Depending on the query you populate in Query 1, the parameters that can be fetched are pre-populated. Type the parameter name and select from the pre-populated list.
11. Display Limit: Select Top or Bottom to display data in descending or ascending order. You can also select from 50, 25, 10 for the data to be populated in the bar widget.
For example, you can view top 25 vulnerabilities of severity 3 with its multiple parameters such as the assets it impacts, the status of vulnerability, the date when it was last detected, the associated QID and so on.