 button. The
widget library is displayed.
button. The
widget library is displayed.You can visualize, consolidate, and communicate data points through a single widget using grouped table widget.
You could build your search query for a vulnerability or asset and then group the search result using pre-defined parameter. Let us see the quick steps to build a grouped table.
1. On the dashboard, click the
Add Widget button. The
widget library is displayed.
2. Click Build your widget.
3. On the right pane, choose the Table widget Type.
4. On the left pane, select Vulnerability Management application.
5. Provide a name for the widget.
6. Select the Show description on widget check box to display the widget description on the dashboard.
7. Click Query Settings.
8. Choose the Display result as: Vulnerability or Asset. The widget result depends on the data set the you select. If you choose Assets, the widget displays the count of assets that match the search query. If you choose Vulnerability, the widget uses the count of vulnerabilities that match the search query.
9. Based on your preference, add an asset or vulnerability query that
you want to populate in the widget. For information on search queries,
refer to Search Tutorial. Using the  search
action menu, you can view the frequently-used QQL queries, save, and manage
them with ease. Looking for the different actions on the search
queries, see Search Actions.
search
action menu, you can view the frequently-used QQL queries, save, and manage
them with ease. Looking for the different actions on the search
queries, see Search Actions.
10. Select Grouped as Table Type.
11. Group By: Select the categorization parameter for the data fetched by search query. Depending on the search result of Query 1, the parameters that can be grouped are pre-populated. Type the parameter name and select from the pre-populated list.
Note: If you select Tags as the Group By option, the Asset Count and Risk Score columns are displayed by default.
11.1 Columns to Display (only for Vulnerability option): For the Vulnerability Management application, in the Group By option select Title. The Columns to Display field is activated. You can display the data by selecting Count, Criticality, Title, CVSS Score, CVE IDs, Severity, Kb Severity, Operating System, Qualys Patchable, Patch Available, Published Date, Updated Date, Category, and QID.
The following screenshot is an example of the Criticality, CVSS Score, and Category of the vulnerabilities Grouped by Title:
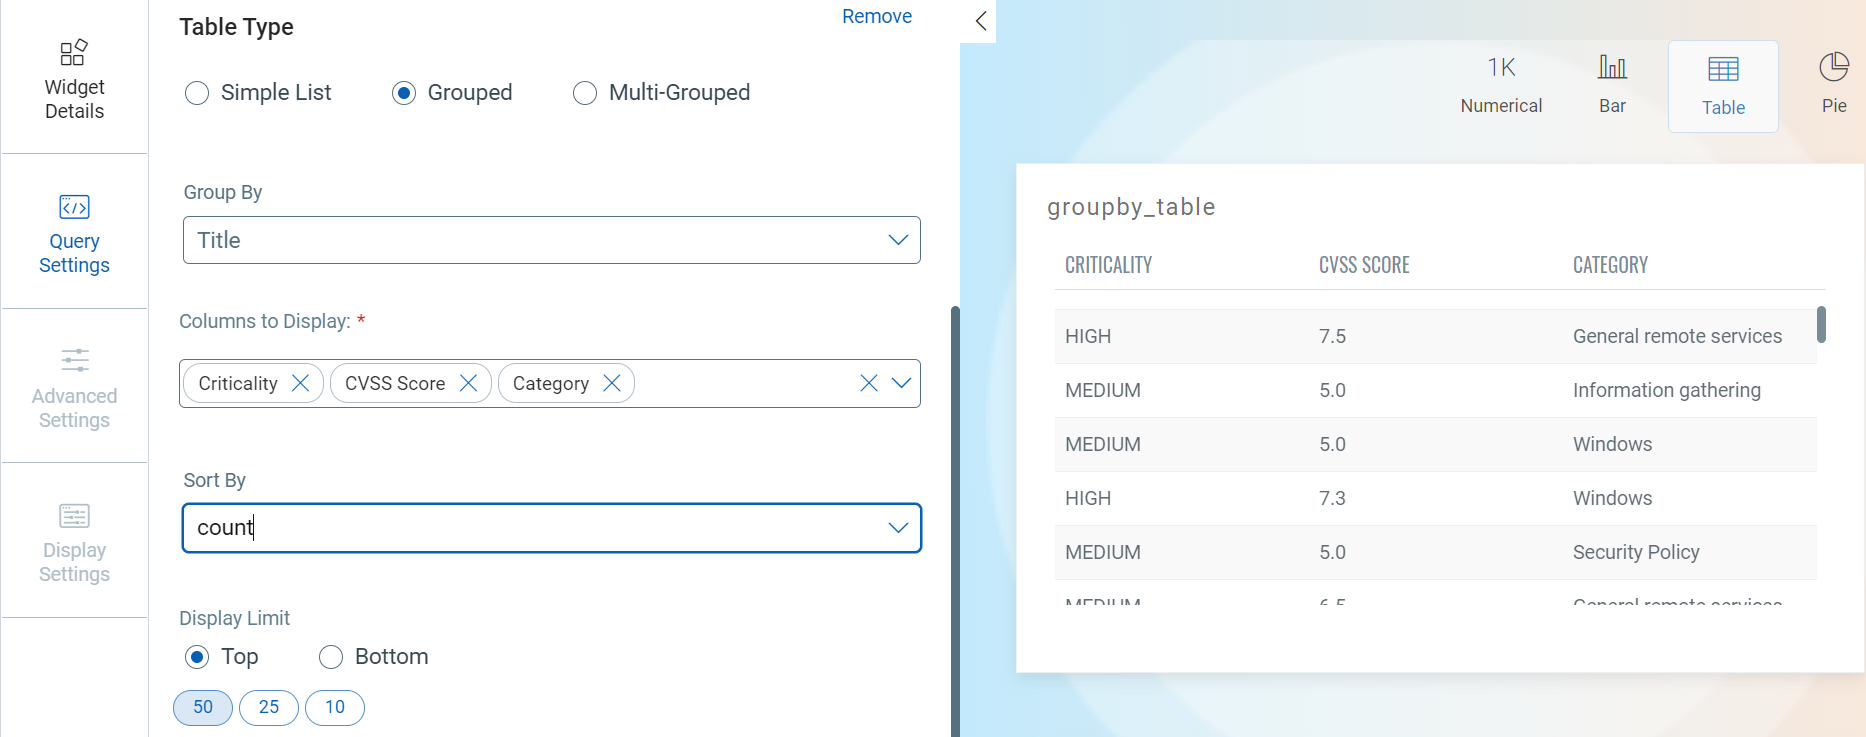
Note: The Trending data is not supported if you select Group By as Title.
12. Sort By (only for Vulnerability option): Choose Count or Severity to sort the data type. The Severity option in the Sort By field is displayed if you select Severity in the Group By field.
13. Display Limit: Select Top or Bottom to display data in descending or ascending order. You can also select from 50, 25, 10 for the data to be populated in the bar widget.
The following screenshot is an example of Top 25 vulnerabilities of severity 3 that are categorized as per the CVSS rating:
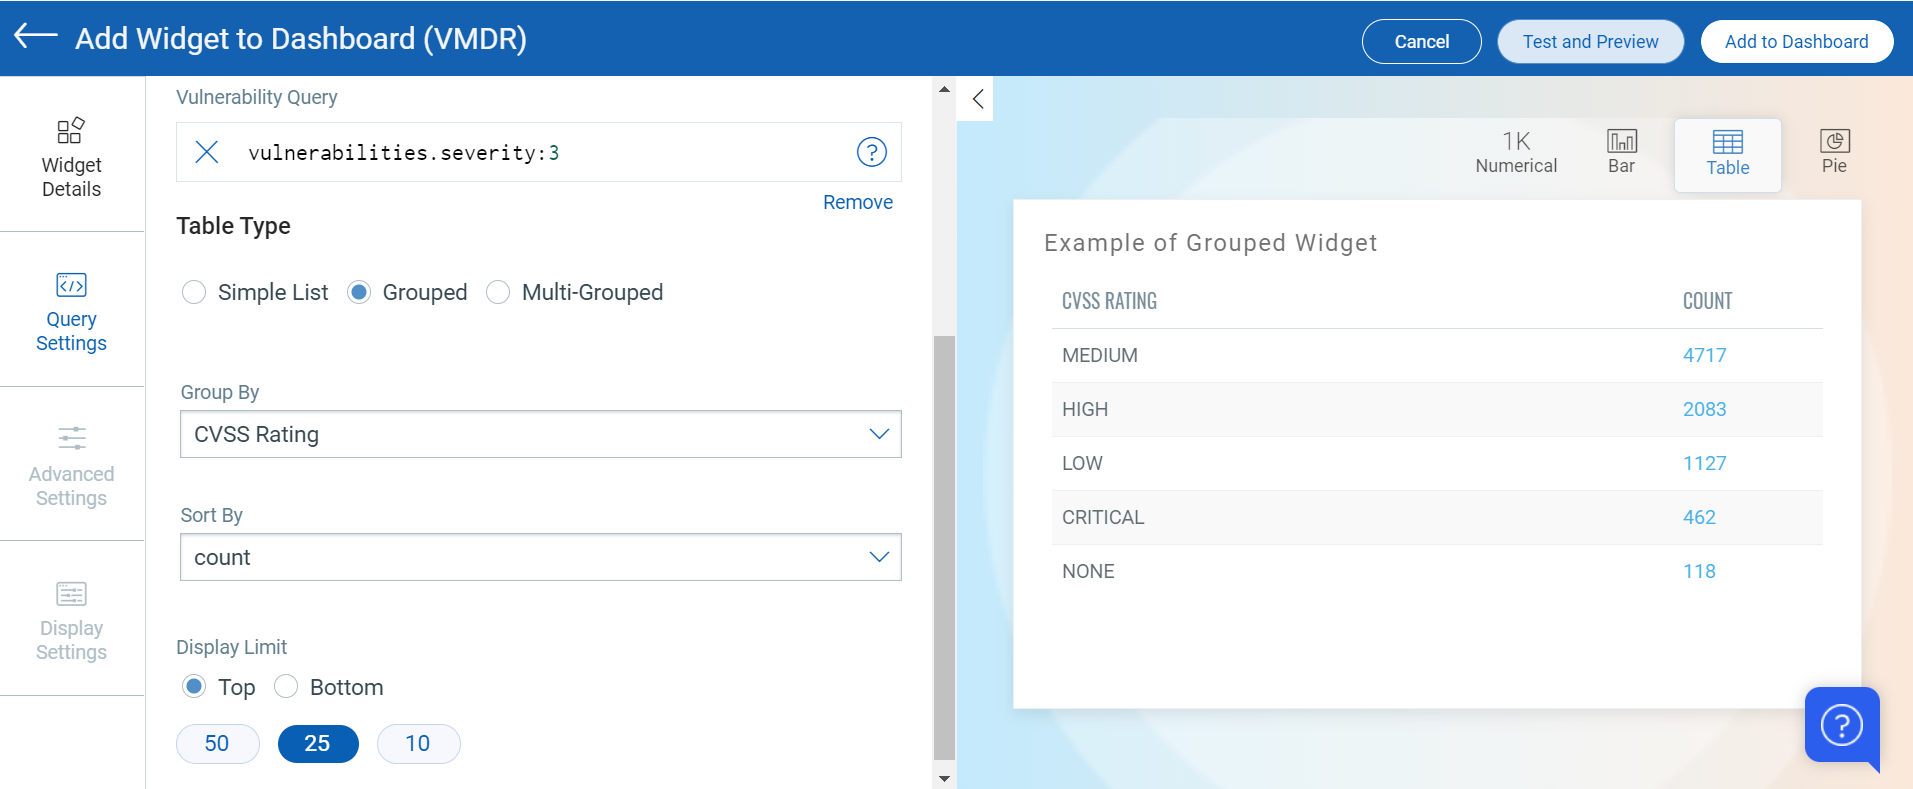
You can view the preview of the widget and configure the parameters as per your requirement. Click Add to Dashboard to complete widget creation and view the widget on the dashboard.