You can create multiple dashboards and switch between them. Each dashboard has a collection of widgets showing event data of interest.
It's easy to do. Just click the down arrow next to the dashboard name and pick the one you want.
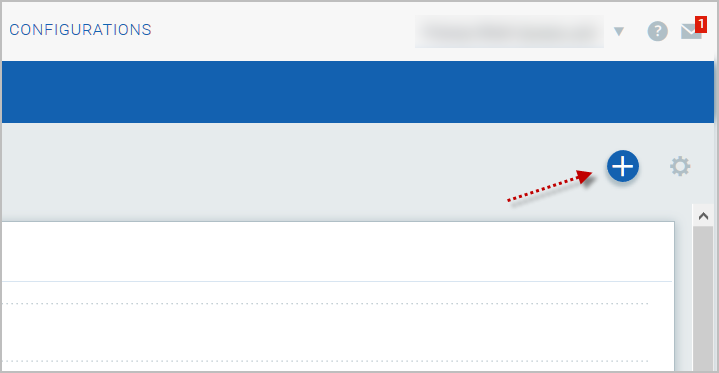
1) Start by clicking the Add Widget icon on your dashboard.
2) Pick one of our widget templates - there are many to choose from - or create your own.
3) Each widget is unique. For some you'll select event data, a query and layout - count, table, bar graph, pie chart.
Wondering how we created the widgets on the default dashboard? Choose Edit from the widget menu to see the settings.
Resize any widget horizontally, drag & drop widgets to change the layout.
1) Click the Tools icon on your dashboard.
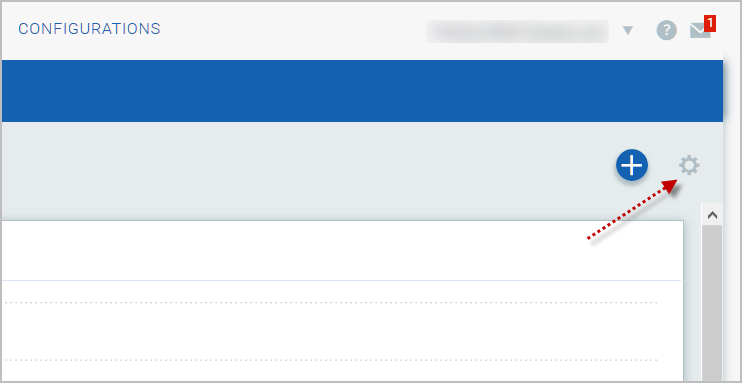
2) Select Edit Dashboard Layout.
3) Adjust the width for any widget or drag the widget to a new location.
4) Click OK to save your changes.
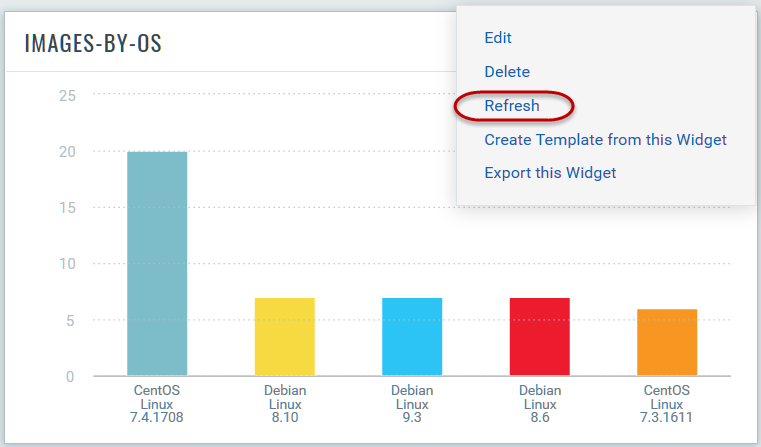
You might want to see the latest data for a particular widget. Select the widget menu and choose Refresh.
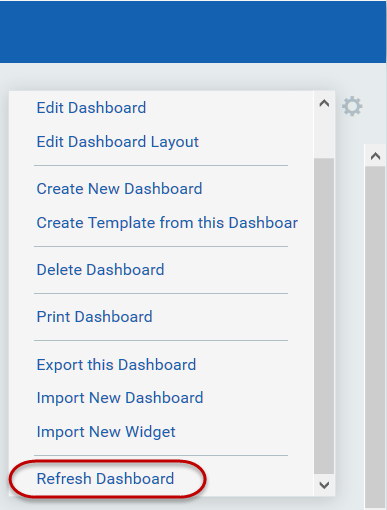
To refresh all widgets in one go, choose the Refresh Dashboard option from the Tools menu and all the widgets on the dashboard will be refreshed.
Note: The following widgets on the "Patch Management Overview" dashboard are not clickable:
- FAILED PATCH INSTALLS
- PATCHES BY STATUS